
user manual
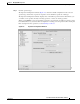


Table Of Contents
- User Guide for Internetwork Performance Monitor
- Contents
- Preface
- Overview of IPM
- Getting Started With IPM
- Using IPM to Measure Network Performance
- Measuring Network Performance for DHCP
- Measuring Network Performance for DLSw
- Measuring Network Performance for DNS
- Measuring Network Performance for HTTP
- Measuring Network Performance for FTP
- Measuring Network Performance for IP
- Measuring Network Performance for SNA
- Measuring Network Performance for TCP
- Measuring Network Performance for UDP
- Measuring Network Performance for Enhanced UDP
- Modifying IPM Components
- Working With Source Devices
- Working With Target Devices
- Working With Operations
- Working With Collectors
- Adding Components Using Seed Files
- Changing IP Addresses
- Setting the Baseline
- Setting IPM Database Preferences
- Setting SNMP Timeout and Retry Environment Variables
- Setting New IPM Server Process Timeout Values
- Setting the DISPLAY Variable in Solaris
- Backing Up or Restoring the IPM Database
- NVRAM Settings
- Managed Source Interface Settings
- Changing Administrative Password
- Changing IPM Database Password
- Working With Message Log Window
- Working With IPM From the CiscoWorks Homepage
- Accessing IPM Data From the CiscoWorks Homepage
- Viewing IPM Server Information
- Importing Devices From Device and Credential Repository
- Downloading the IPM Client
- Viewing Configuration Information
- Viewing Latency Data
- Viewing Jitter Data
- Viewing HTTP Data
- Accessing Software Updates and Additional Information
- IPM FAQs and Troubleshooting Tips
- IPM Command Reference
- SA Agent Feature Mapping
- Glossary
- Index

4-12
User Guide for Internetwork Performance Monitor
OL-11291-01
Chapter 4 Modifying IPM Components
Working With Collectors
Viewing a List of Defined Collectors
All of the defined collectors are listed in the IPM Main Window (Figure 2-2). Any collectors with start
dates and times earlier than the current date and time, and end dates and times later than the current date
and time, are considered active collectors.
The following status information appears about each collector in the IPM Main Window:
• Collector name
• Source
• Target
• Operation
• Start Time
• Duration
• Type
• Status
You can sort the collector information displayed in the IPM Main Window by clicking on the column
titles. By default, the information is sorted based on collector name. Optionally, you can sort the
information based on start time, target, or operation type.
Viewing a Collector State Summary
To view a summary of the number of collectors on the server, broken down by current state (Running,
Expired, and so on), select View > Collector State Summary from the IPM Main Window. The
Collector State Summary window (Figure 4-5) appears.
For information about these fields, see the “Collector State Summary Window” topic in the online help.