
user manual

13-14
Cisco Aironet 1200 Series Access Point Software Configuration Guide
OL-2159-05
Chapter 13 Diagnostics and Troubleshooting
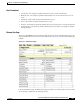
Using Diagnostic Pages
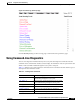
Log Headings
The event log is divided into three columns:
• Time—The time the event occurred. The log records time as cumulative days, hours, and minutes
since the access point was turned on, or as wall-clock time if a time server is specified or if the time
has been manually set on the access point.
• Severity—Events are classified as one of four severity levels depending on the event’s impact on
network operations. Severity levels include:
–
Info (green)—Indicates routine information; no error.
–
Warning (blue)—Indicates a potential error condition.
–
Alert (magenta)—Indicates that an event occurred which was pre-selected as something to be
recorded in the log. A typical example of an alert would be a packet error condition. The Station
page provides check boxes that activate reporting of packet errors to and from the station as
alerts in the event log.
–
FATAL (red)—An event which prevents operation of the port or device. For operation to resume,
the port or device usually must be reset.
Click the Severity heading to go to the Event Log Summary page, which lists total events for each
severity level.
• Description—This column describes the nature or source of the event. If a network device is
involved in the event, the device’s MAC or IP address appears and provides a direct link to the
device’s Station page.
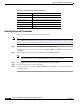
Saving the Log
To save the event log, click Download Event Log. In Microsoft Explorer, the log is saved as a text file.
In Netscape Communicator, the log file is displayed on the screen, and you select Save As from
Communicator’s File pull-down menu to save the log.
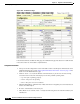
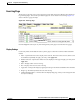
Event Log Summary Page
The Event Log Summary page lists the total number of events that occurred at each severity level.
Figure 13-10 shows an Event Log Summary page example.