
user manual

13-4
Cisco Aironet 1200 Series Access Point Software Configuration Guide
OL-2159-05
Chapter 13 Diagnostics and Troubleshooting
Using Diagnostic Pages
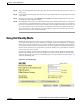
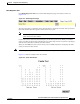
The bar graph on the left side of the window displays the percentage used for each frequency; the highest
current percentage used is labeled on the top left of the graph. In this example, the highest percentage
used for any frequency is 77. The access point’s available frequencies are listed vertically across the
bottom of the graph, from 2412 to 2462 GHz. The access point’s channel 1 is 2412 GHz, channel 2 is
2417 GHz, and so on up to channel 11, which is 2462 GHz.
The bar graph on the right side of the window displays the amount of noise on each frequency. Click
Stop Test in the window or on the Radio Diagnostics page to stop the test.
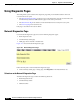
VLAN Summary Status
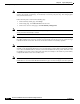
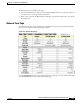
Click VLAN Summary Status to reach the VLAN Summary Status page for your access point.
Figure 13-4 shows a typical VLAN Summary Status page.
Figure 13-4 VLAN Summary Status Page
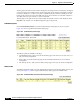
The following links are available on the page:
• VLAN Detailed Setup—takes you to the VLAN Setup page, from which you can add, remove, or
edit your VLAN configuration.
• ID(#)—takes you to the VLAN Setup page for the VLAN ID selected where you can edit the
configuration.
• Def. Pol. Grp (if set)—takes you to the Policy Groups page, where you can edit the configuration.
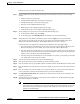
SSIDs: Int, Mod
The SSIDs: Int, Mod link takes you to the AP Radio Internal Service Set Summary Status page for your
access point. Figure 13-5 shows a typical SSID Summary Status page for the Module radio.
Figure 13-5 AP Radio Module Service Set Summary Status Page