A P P E N D I X J Troubleshooting This chapter offers troubleshooting steps to help solve high-level problems while operating CTM or CTM GateWay. Follow the troubleshooting procedures described in this chapter before contacting Cisco technical support. This chapter includes the following troubleshooting information: Note • J.1 Overview, page J-1 • J.2 Server Problems, page J-2 • J.3 Client Connectivity Problems, page J-11 • J.4 Client Operational Problems, page J-13 • J.
Appendix J Troubleshooting J.2 Server Problems Note This chapter assumes that the server is installed under the default /opt/CiscoTransportManagerServer directory and the client is installed under the default /opt/CiscoTransportManagerClient (Solaris) or C:\Cisco\TransportManagerClient directory (Windows). If a directory other than the default installation directory is specified, replace the default path with the installed path. J.
Appendix J Troubleshooting J.2.2 CTM Server Does Not Respond If you are experiencing any of these conditions, contact your account representative. Your account representative can engage Cisco’s Advanced Services team to audit your CTM server and recommend a higher-capacity server and resources. J.2.2 CTM Server Does Not Respond Step 1 Log in as the root user on the Solaris workstation where the CTM server is installed.
Appendix J Troubleshooting J.2.3 Cannot Connect to the CTM Server Step 2 Verify that the first entry in the /var/opt/oracle/oratab file looks similar to CTM6_0:/oraclesw9i/product/9.2:Y. If this entry is missing, the Oracle database might not be installed. The Oracle database is a prerequisite for installing the CTM server. J.2.3 Cannot Connect to the CTM Server Step 1 Ping the server’s IP address from the client PC or workstation.
Appendix J Troubleshooting J.2.4 NE Connection State Is Listed as Unavailable sudo ctms-start Step 11 Wait for 5 minutes and run the client. J.2.4 NE Connection State Is Listed as Unavailable If the connection state of an NE is listed as Unavailable in the Domain Explorer window, a connectivity or configuration problem exists. Wait 5 to 10 minutes after adding the NE to the CTM domain; then, complete the following steps: Step 1 To see the NE IP address, select the NE in the Domain Explorer window.
Appendix J Troubleshooting J.2.5 Launching Tables Results in Database Errors J.2.5 Launching Tables Results in Database Errors If the Oracle database or Oracle listener that CTM is using is down, launching tables will generate database errors.
Appendix J Troubleshooting J.2.8 Problems with ONS 15530 and ONS 15540 Configuration J.2.8 Problems with ONS 15530 and ONS 15540 Configuration ONS 15530 and ONS 15540 NEs must be properly configured to send traps to the server.
Appendix J Troubleshooting J.2.10 CTC-Based NE Is Not Discovered Step 6 Verify that the NE is reachable during the duration that PM data is collected. If the NE is not reachable, there is an entry in the Audit Log table (Administration > Audit Log). J.2.10 CTC-Based NE Is Not Discovered Step 1 Verify that the NE is up and running. Step 2 Verify that the NE IP address and default route are configured correctly.
Appendix J Troubleshooting J.2.13 Circuits Are Not Displayed • In the running configuration, the community strings are shown in entries similar to the following: snmp-server community public RO snmp-server community private RW In this example, the read string is public, and the read/write string is private. Step 3 If IP connectivity and community strings are verified and the device is still unavailable, check the error log for any errors reported by ONS 155xx NE Service. J.2.
Appendix J Troubleshooting J.2.16 Cannot Copy CTC Binary to the CTM Server J.2.16 Cannot Copy CTC Binary to the CTM Server If a CTC binary fails to be copied to the CTM server, the /cms/ directory might be missing or write-protected. If the directory is missing, create a cms directory with write-access permissions. Otherwise, change the permissions of the existing cms directory to allow write access. J.2.
Appendix J Troubleshooting J.2.20 Using the get nestate Command J.2.20 Using the get nestate Command The get nestate command-line interface (CLI) command available in the ctm utility in the EMS server bin directory returns the provisioned operational state (NE_Info_Table: NEState) and the read-only modifiers to the operational state (NE_Info_Table: NEDiscoveryState).
Appendix J Troubleshooting J.3.2 Database Timeout Occurs J.3.2 Database Timeout Occurs Step 1 Reduce the scope of the query by selecting a group or an NE and not the entire domain before opening tables such as the Alarm Browser, Alarm Log, Audit Log, and PM tables. Step 2 Increase the client database query timeout period by editing the ems-client.cfg file in the C:\Cisco\TransportManagerClient\config or /opt/CiscoTransportManagerClient/config directory.
Appendix J Troubleshooting J.3.5 Cannot Authenticate User Message Appears Step 4 If the provisioner or operator is in the CTM Users table, select the row corresponding to that user and click the Modify User Properties tool to bring up the Modify CTM User Properties wizard. Verify that the Login State field is set to Enabled. If the login state is disabled, enable it and log in as the provisioner or operator. The user might have been disabled after attempting to log in with an incorrect password.
Appendix J Troubleshooting J.4.2 Cannot Delete an NE J.4.2 Cannot Delete an NE If an NE cannot be deleted, verify that the user logged in as SuperUser or NetworkAdmin—not as a Provisioner or Operator. Provisioners and Operators cannot delete NEs. If the user logged in as Provisioner or Operator, restart the CTM client session and log in as SuperUser. J.4.
Appendix J Troubleshooting J.4.5 Cannot Delete a Subnetwork Step 9 Click Save. J.4.5 Cannot Delete a Subnetwork If a subnetwork cannot be deleted from the Subnetwork Explorer, complete the following steps: Step 1 Verify that the user logged in as a SuperUser—not as a Provisioner or an Operator. Provisioners and Operators cannot delete subnetworks. If the user logged in as a Provisioner or Operator, restart the CTM client session and log in as a SuperUser.
Appendix J Troubleshooting J.4.8 ONS 15800, ONS 15801, or ONS 15808 NE Generates Too Many Alarms J.4.8 ONS 15800, ONS 15801, or ONS 15808 NE Generates Too Many Alarms Occasionally, ONS 15800, ONS 15801, and ONS 15808 NEs generate so many alarms that the CTM client cannot process all of them.
Appendix J Troubleshooting J.4.11 Cannot Customize the Network Map J.4.11 Cannot Customize the Network Map If an image file is not displayed while changing the Network Map background or while changing a node icon, complete the following steps: Step 1 Choose another image file. The file might be corrupt. Step 2 Check the size of the image file. The image file might be larger than 100 KB, which is too big to load. If the file is too big, use a smaller image file.
Appendix J Troubleshooting J.4.13 How Do I Collect Thread Dumps? The resolution in 24-bit depth is a little lower than is possible with 8-bit depth (1152 x 900 x 76 versus 1280 x 1024 x 76), but the difference is hardly noticeable. Note J.4.13 How Do I Collect Thread Dumps? Thread dumps are helpful references when debugging the CTM process. To collect thread dumps: Step 1 Log into the server workstation as the root user.
Appendix J Troubleshooting J.4.14 How Do I Enable or Disable the Automatic Refresh Data Action? – ONS15808NEService – UnmanagedNEService – ONS15216PMService – ONS15302PMService – ONS15305PMService – ONS15310PMService – ONS15327PMService – ONS15454PMService – ONS15454SDHPMService – ONS15501PMService – ONS15530PMService – ONS15540PMService – ONS15600PMService – ONS15600SDHPMService – ONS15800PMService – ONS15801PMService – ONS15808PMService J.4.
Appendix J Troubleshooting J.4.15 How Do I Replace the Alarm Interface Panel? J.4.15 How Do I Replace the Alarm Interface Panel? The Alarm Interface Panel (AIP) provides surge protection for CTC-based NEs. This panel has a nonvolatile memory chip that stores the unique node address known as the MAC address. The MAC address identifies the nodes that support circuits. It allows CTM to determine circuit sources, destinations, and spans.
Appendix J Troubleshooting J.6 CTM GateWay/TL1 Problems /bin/ctm-large-debug.exe /bin/ctm-highend-debug.exe On Solaris, you can start the CTM client with a console window that displays exceptions and client debug messages. You can use these messages to help troubleshoot any client problems. Depending on your network size, enter one of the following commands to start the client with a console window: ctmcdebug-start ctmcdebug-start ctmcdebug-start ctmcdebug-start –small –medium –large –highend J.
Appendix J Troubleshooting J.8 Cisco CRS-1 and Catalyst 6509 Problems J.8 Cisco CRS-1 and Catalyst 6509 Problems This section describes troubleshooting procedures for problems related to the Cisco CRS-1 and the Catalyst 6509. J.8.1 CRS-1 Communication State Remains Unavailable After Marking the Device as In Service Step 1 Verify that the CRS-1 is configured with “hfrems” as the username and “hfrems” as the password with “root-system” privileges.
Appendix J Troubleshooting J.8.3 CTM Does Not Receive Configuration Changed Notifications from the CRS-1 Step 3 Verify that CTM supports the software image that is running on the Catalyst 6509. In the Domain Explorer, choose Administration > Supported NE Table and verify that the software version is supported. Note Step 4 For the Catalyst 6509, the supported software version is Release 6.3(7) or later.
Appendix J Troubleshooting J.8.5 CTM Does Not Receive syslog Events from the Catalyst 6509 Note Step 4 The set snmp trap enable all command enables traps only on physical ports. For logical ports such as sc0 or sc1, you must enable traps separately. Go to Step 4.
Appendix J Troubleshooting J.8.6 CTM Does Not Collect Historical PM Data for the CRS-1 ... sys ... vmps vtp 0(emergencies) 3(errors) 6(information) 5 5 2 2 2 2 1(alerts) 4(warnings) 7(debugging) 2(critical) 5(notifications) J.8.6 CTM Does Not Collect Historical PM Data for the CRS-1 Step 1 Verify that PM collection is enabled for the CRS-1. To do this, go to the Network Element Properties > Status tab and in the PM Collection area, check the 15 Min check box. Click Save.
Appendix J Troubleshooting J.8.7 CRS-1 PM Tables Collect Data at the Wrong Collection Interval sample-interval 15 ! Step 3 If the files are not being dumped to the target directory on the TFTP server, verify that the TFTP server is using the correct tftpd (tftp daemon binary). The tftpd should be a version that allows the CRS-1 to create new files in the specified directory. The default tftpd only allows pre-existing TFTP files to be written. The default tftpd does not create new TFTP files.
Appendix J Troubleshooting J.8.9 How Do I Back Up the CRS-1 Configuration File Automatically Whenever the Configuration Is Changed on the J.8.9 How Do I Back Up the CRS-1 Configuration File Automatically Whenever the Configuration Is Changed on the Router? Step 1 In the Domain Explorer, choose Administration > Control Panel. Step 2 Click NE Service. Step 3 In the NE AutoBackup tab, choose Cisco CRS-1 as the NE model. Alternately, choose All NE Models. Step 4 Check the Enable Auto Backup check box.
Appendix J Troubleshooting J.8.11 Cannot Delete an Out-of-Service NE from CTM Step 3 Enter the following commands to enable CDP on both NEs: Router-1(config)# cdp Router-1(config)# commit Router-2(config)# cdp Router-2(config)# commit J.8.11 Cannot Delete an Out-of-Service NE from CTM If you cannot delete an out-of-service NE from CTM, follow the procedure in 3.5.7.3 Using the prune_ne.sh Script to Remove an Out-of-Service NE from the Database, page 3-27. J.8.
Appendix J Troubleshooting J.8.
Appendix J Troubleshooting J.8.19 How Do I Load a Software Image on the Catalyst 6509? The output is similar to the following example: -#- -length- -----date/time------ name 2 5849256 Aug 09 2004 14:41:25 cat6000-sup2.6-3-7.bin 3 8801412 Aug 09 2004 15:30:57 cat6000-sup2k8.8-3-2.bin 4 5713736 Aug 11 2004 13:08:02 cat6000-sup2.6-3-2a.bin 5 8182352 Aug 12 2004 09:15:00 cat6000-sup2k8.8-2-1.bin 17 1786 Aug 23 2004 14:16:30 6509svt-171-180 19 1688 Sep 24 2004 15:26:40 6509svt-171-180.
Appendix J Troubleshooting J.9 XR 12000 Problems J.9 XR 12000 Problems This section describes troubleshooting procedures for problems related to the XR 12000. J.9.1 Reporting XR 12000 Issues When reporting an XR 12000 problem, include detailed steps to reproduce the problem and the software version(s) of the NE(s) to which the problem applies.
Appendix J Troubleshooting J.9.3 XR 12000 Status Is Not Immediately Reflected in the Domain Explorer Step 6 The NE hostname specified in DNS or in the CTM server /etc/hosts file must match the hostname configured on the NE. If the hostnames do not match, the NE is moved to an LOC state in CTM. J.9.3 XR 12000 Status Is Not Immediately Reflected in the Domain Explorer If the LAN cable is removed, there is a delay before the status of the XR 12000 is updated in the Domain Explorer.
Appendix J Troubleshooting J.9.6 XR 12000 BGP and CDP Neighbor Discovery Issues Step 2 Enter the following commands to verify that the router’s running configuration contains the correct PM configuration: performance-mgmt sample-size 1 sample-interval ! performance-mgmt sample-size 1 sample-interval ! performance-mgmt sample-size 1 sample-interval ! . . . .
Appendix J Troubleshooting J.10 Problems with MGX Voice Gateway Devices On UNIX, enter the /bin/ctmcdebug-start command to start the client and repeat the same operation. This generates the error and exception messages on the terminal. Capture the terminal messages for debugging. J.10 Problems with MGX Voice Gateway Devices This section describes troubleshooting procedures for problems related to the MGX Voice Gateway devices. J.10.
Appendix J Troubleshooting J.10.2 Discovery Issues at Startup b. Step 3 Compare this community string with the community string in the node_info table. The community string in the node_info table is encrypted. You will need to decrypt this string and verify it. For MGX nodes, if persistent topology is enabled on the switch gateway and some nodes in a peer group are not discovered, complete the following substeps: a.
Appendix J Troubleshooting J.10.2 Discovery Issues at Startup J.10.2.3 Node IP Is Incorrect in the Database Step 1 If the node table contains the correct IP address, complete the following substeps: a. Enter the following command to dump the cache of topod and ILMITopoc: kill -USR1 b. Step 2 From the data collected, verify which process has the incorrect information. If the information is correct in all processes, open a new instance of the GUI and verify whether the problem still exists.
Appendix J Troubleshooting J.10.2 Discovery Issues at Startup J.10.2.5 Reachable Node Is Shown as Unreachable If a node that is reachable from CTM is shown as unreachable in the Configuration Center, Chassis View, Diagnostics Center, or Statistics Report, complete the following steps: Step 1 If the node table reports the alarm state of this node as minor, major, critical, or clear, complete the following substeps: a.
Appendix J Troubleshooting J.10.3 Discovery Issues at Runtime Step 2 Enter the community strings (SNMP-GET and SNMP-SET) of the node through the Domain Explorer > Network Element Properties pane > NE Authentication tab. The SNMP strings might be incorrect in the node_info table. The strings can be verified if the decrypt tool for the encrypted strings is available in the database. Step 3 Check the nts.log to see if trap registration succeeded for the node. See J.10.13.1 NTS, page J-127.
Appendix J Troubleshooting J.10.3 Discovery Issues at Runtime Step 4 If the preceding steps do not solve the problem, delete the node from the network and add it again. J.10.3.
Appendix J Troubleshooting J.10.4 Equipment Management Problems Step 2 If the node table does not have an entry for the node with the correct IP address, complete the following substeps: a. Check the ILMItopoc log and verify whether it received a 60007 and 70202 trap. b. If you see the trap in the log, verify that ILMITopoc updates its cache based on the trap. c. If you do not see the traps in the ILMITopoc.log, see J.10.13.1 NTS, page J-127.
Appendix J Troubleshooting J.10.4 Equipment Management Problems J.10.4.2 Network Setup and Configuration Required for OOEMC Sync-Up Process The EM requires network setup and CTM configuration prerequisites before it can start the sync-up process. On the switch, perform the following: • Use the dsptrapmgr CLI command to verify that the CTM IP address has been added to the trap manager.
Appendix J Troubleshooting J.10.4 Equipment Management Problems Step 3 If the rtm link up message for the node is found and the log indicates that notification to ooemc has been sent, then collect the log files and report the problem. Step 4 If the rtm link up message cannot be found, then search for link down message. Grep RTM_LINK_DOWN from the emd log files. If the rtm link down message is found, then the node is not reachable by the nts process. Check with the network administrator and see J.10.
Appendix J Troubleshooting J.10.4 Equipment Management Problems Note It should not take long to declare node resync failure because of the SNMP request failure. To verify that there is an SNMP failure, check the ooemc and snmpcomm log files. Note Using ooemc10.6568.log as an example of an ooemc log filename, 10 is the child ID, the 6568 is the ooemc process ID. The child ID is calculated from the following formula: Remainder (NEDBACCSSID / number of ooemc child) + 1.
Appendix J Troubleshooting J.10.4 Equipment Management Problems 9. SM_CARD_01_RPM.CF 10. PNNI_01_CC.CF Files 1 and 2 are uploaded for each NBSM. Files 4 to 7 are uploaded for each AXSM. File 9 is uploaded for all RPM/RPM-PR cards on the switch. The following files are uploaded from the MGX NE. It includes VISM, AXSM, VXSM, SRM, RPM/RPM-PR, and RPM-XF cards: 1. CARD_01_CC.CF 2. SM_1_slot#.CF 3. SM_1_slot#.CS 4. SM_CARD_01_slot#.CF 5. SM_CONN_01_slot#.CF 6. SM_ALARM_01_slot#.CF 7.
Appendix J Troubleshooting J.10.4 Equipment Management Problems Step 1 3. The ooemc receives bulk file creation-related traps: 60901, 60902, and 60903. 4. The ooemc FTPs the config upload files from the switch after it has received 60901 and 60902 from the switch. 5. The ooemc parses the config upload files. 6. The ooemc declares sync-up done. Determine if the problem is caused by the SNMP request: a. Grep RESYNC from the ooemc log files.
Appendix J Troubleshooting J.10.4 Equipment Management Problems J.10.4.6 CTM Database Is Inconsistent with Switch Data After Successful Coldstart (CTM Server Stop/Start) or Periodic Resync After a successful node resynchronization triggered by the periodic resync, the CTM database is found to be inconsistent with the switch data. Step 1 Collect the ooemc log files and all config upload files for the node. The ooemc implements a node-based cache. You can dump and save the cache.
Appendix J Troubleshooting J.10.4 Equipment Management Problems • Collect config upload files from the /opt/svplus/tmp directory. Possible alternative workaround is to manually resync the node. If the problem persists, perform a coldstart. If the problem is still not resolved, collect the log files and report the problem. J.10.4.
Appendix J Troubleshooting J.10.
Appendix J Troubleshooting J.10.4 Equipment Management Problems J.10.4.9 CTM Database and Switch Data Inconsistency Issues After Node Provisioning for MGX This section includes the following information: • J.10.4.9.1 Database Table Population Through Traps and SNMP Upload, page J-49 • J.10.4.9.2 Switch Data Does Not Match CTM Database Table After Node Provisioning, page J-49 J.10.4.9.
Appendix J Troubleshooting J.10.
Appendix J Troubleshooting J.10.
Appendix J Troubleshooting J.10.4 Equipment Management Problems • VxsmCrr Trap • VxsmTone Trap • VxsmAs Trap • VxsmAsp Trap • VxsmAs Trap • VxsmLapd Trap • VismABCDBitTemplate Trap Review the log messages using the traplist command and decide how you can grep the messages according to your needs. In the above example, there is another key word ("PROCESSED") that indicates that the trap has been processed.
Appendix J Troubleshooting J.10.5 Configuration Center, Chassis View, Diagnostics Center, and Statistics Report Problems J.10.5 Configuration Center, Chassis View, Diagnostics Center, and Statistics Report Problems This section includes the following information: • J.10.5.1 CTM Configuration Center, Chassis View, Diagnostics Center, or Statistics Report Basics, page J-53 • J.10.5.2 Basic Issues, page J-55 • J.10.5.3 Topology Discovery Issues, page J-56 • J.10.5.
Appendix J Troubleshooting J.10.
Appendix J Troubleshooting J.10.5 Configuration Center, Chassis View, Diagnostics Center, and Statistics Report Problems – Configuration—Dumps the configuration data to the dump file. • nmClient—This utility is used to isolate an issue between client and server. It is used to query the NMServer the same way as the Configuration Center, Chassis View, Diagnostics Center, or Statistics Report GUI queries the server. Output is redirected to /opt/svplus/log/nmClient.log.
Appendix J Troubleshooting J.10.5 Configuration Center, Chassis View, Diagnostics Center, and Statistics Report Problems Possible alternative workaround—Open a new GUI and a new Configuration Center, Chassis View, Diagnostics Center, or Statistics Report GUI. J.10.5.2.2 Configuration Center, Chassis View, Diagnostics Center, or Statistics Report Is Unable to Connect to Server Step 1 Check whether the client registers in NMServer.log.
Appendix J Troubleshooting J.10.5 Configuration Center, Chassis View, Diagnostics Center, and Statistics Report Problems J.10.5.3.1 Configuration Center, Chassis View, Diagnostics Center, or Statistics Report Does Not Show a Node Step 1 Check whether the nodes are discovered. See J.10.2.1 No Nodes Are Discovered, page J-34 for more information. Step 2 Check whether NMServer has the nodes in its cache. This can be done by using the command nmControl on the CTM CLI.
Appendix J Troubleshooting J.10.5 Configuration Center, Chassis View, Diagnostics Center, and Statistics Report Problems Step 3 Check the node in the NMServer's cache. This can be done by using the command nmControl in the CTM CLI. Step 4 Check the CMSCclient.log for the node/trunk. Verify whether a delete message was received for the node. Step 5 From nmClient, use the getTopology option to retrieve the node information and verify whether it matches the database and GUI.
Appendix J Troubleshooting J.10.5 Configuration Center, Chassis View, Diagnostics Center, and Statistics Report Problems Step 6 If duplicate nodes are not present in the NMServer cache, open a new GUI and verify whether the node is shown in it. Defect Information—Collect the following information for further analysis: • CMSCclient.log file under /opt/svplus/log. For PC Client, collect CMSCclient.log file under D:\Documents and Settings\\log.
Appendix J Troubleshooting J.10.5 Configuration Center, Chassis View, Diagnostics Center, and Statistics Report Problems Possible alternative workarounds: 1. Open a new GUI and a new Configuration Center, Chassis View, Diagnostics Center, or Statistics Report. 2. Use nmControl and perform "Resync Node," specifying the node ID. J.10.5.4.
Appendix J Troubleshooting J.10.5 Configuration Center, Chassis View, Diagnostics Center, and Statistics Report Problems Step 6 Use nmClient and verify whether getChildren for FDN returns the correct information for the element in the nmClient..dump file. Step 7 If the element is present in the NMServer cache, open a new GUI and verify whether the missing elements are shown in it. Defect Information—Collect the following information for further analysis: • topod.log, ILMITopoc.log, and NMServer.
Appendix J Troubleshooting J.10.5 Configuration Center, Chassis View, Diagnostics Center, and Statistics Report Problems J.10.5.5 Configuration Center, Chassis View, Diagnostics Center, or Statistics Report Alarm Issues This section includes the following information: • J.10.5.5.1 Alarm Processing Basics, page J-62 • J.10.5.5.2 XML Schema for Alarm Rules, page J-63 • J.10.5.5.3 Alarm Severity and Object Severity, page J-65 • J.10.5.5.
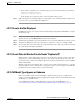
Appendix J Troubleshooting J.10.5 Configuration Center, Chassis View, Diagnostics Center, and Statistics Report Problems Figure J-2 Client/Server Architecture for Alarm Components Alarm Client Alarm Service Client Alarm Observer Network Monitor Server (Alarm Components) Alarm Service Object Tree 120750 Alarm Repository Client Handler J.10.5.5.2 XML Schema for Alarm Rules Alarm rules are defined in XML, specifically, in a file named $HOME/xml/ruledata.xml.
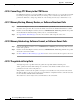
Appendix J Troubleshooting J.10.5 Configuration Center, Chassis View, Diagnostics Center, and Statistics Report Problems Figure J-3 Correlated Alarm Rule Diagram A CorrelatedRule can have any of the following: • 1 AlwaysClear (Used when a given element never has an alarm, such as in a top-level network) • 0 or more ClearAlarmCondIds • 1 new alarm (which consists of NewAlarmConditionID, NewAlarmServAffect, and so on.) 2.
Appendix J Troubleshooting J.10.5 Configuration Center, Chassis View, Diagnostics Center, and Statistics Report Problems A CorrelatedBmRule can have any of the following: • 0 or more ClearAlarmCondIds • 1 new alarm (which consists of NewAlarmConditionID, NewAlarmServAffect, and so on) 3. Transient Alarm Rule Type The transient alarm rule type is used to distinguish events from alarms. The alarm list shows some events. Events are normally associated with the NMS itself.
Appendix J Troubleshooting J.10.5 Configuration Center, Chassis View, Diagnostics Center, and Statistics Report Problems 6 7 Sync-Up has not started yet This alarm will occur if the southbound processes (EMs) send a node message with EM sync-up status as 1 or -1. If that does occur, then the node should be unreachable severity (value 7) in the tree view.
Appendix J Troubleshooting J.10.5 Configuration Center, Chassis View, Diagnostics Center, and Statistics Report Problems c. Step 4 Verify whether or not the alarms are aggregate port alarms. If so, this is expected behavior and there is no defect. If there are alarms that have greater severity then what is shown on the platform, and they are not aggregate port alarms, continue to the next step to see whether the alarm is in the database. Verify whether the database has the correct alarm state.
Appendix J Troubleshooting J.10.5 Configuration Center, Chassis View, Diagnostics Center, and Statistics Report Problems Possible alternative workaround—Open a new GUI and a new Configuration Center, Chassis View, Diagnostics Center, or Statistics Report. J.10.5.5.6 Transient Event Has Disappeared Unexpectedly Transient alarms behave somewhat differently depending on whether the entity is managed by the network element or the NMS itself.
Appendix J Troubleshooting J.10.6 Chassis View Problems c. Step 2 Click the Get button. The connections should be listed, and the alarm status should match the alarm status in the alarm list. If the connection alarms do not match the aggregate port alarm(s) in Alarm List GUI, there may be a defect. Collect the following defect information: • CMSCclient.log, NMServer.log, sdbroker*.log, xdbroker*.log • Capture NMServer dump, use nmControl Possible alternative workaround—None. J.10.
Appendix J Troubleshooting J.10.6 Chassis View Problems Chassis View displays the chassis by combining static data from the XML file and dynamic data from the database. The first step in debugging is to determine if data is populated properly in the database. The next step is to check that the card or line is defined in the XML file. J.10.6.2 Lines Not Displayed in the Chassis View Step 1 Determine if data about the lines are populated for the corresponding lines in the line table in the database.
Appendix J Troubleshooting J.10.6 Chassis View Problems d. Save the log as CMSCclient.log to your local drive. e. Take a copy of the chassisview.jar from the /opt/svplus/java/jars/cwm/ directory. You need to check that gif files used to draw the lines are available in the jar. Possible alternative workaround—Select the cards from the tree view to launch other applications. J.10.6.4 DCA/DCB Status Not Displayed on PXM Cards DCA/DCB status is always grayed out in Chassis View.
Appendix J Troubleshooting J.10.7 Configuration Center Management J.10.6.10 Lines Not Selectable Sometimes lines become unselectable. For example, when trying to select line 3, line 1 may get selected or vice versa. Lines must be spaced sufficiently apart. If they are not, they may overlap, causing them to become unselectable. Defect Information—Collect the following information for further analysis: • Get the copy of the ChassisView.xml file used. • Take a copy of the chassisview.
Appendix J Troubleshooting J.10.7 Configuration Center Management • Network elements can be selected in the tree view and the Configuration Center (Elements Tab) can be launched to view or modify the selected object. • Network elements can be dragged and dropped from other application to the Configuration Center's Elements tab for modification. This section includes the following information: • J.10.7.1.1 Cannot Launch the Configuration Center, page J-73 • J.10.7.1.
Appendix J Troubleshooting J.10.7 Configuration Center Management Step 1 • Choose an application from the Tools menu item. • Right-click on the selected object from the hierarchical tree and choose the target application. Check the target application jar file. Make sure the target application jar file is located in the /opt/svplus/java/jars/cwm directory of the target machine. Defect Information—Collect the following information for further analysis: • CMSCclient.
Appendix J Troubleshooting J.10.7 Configuration Center Management J.10.7.1.5 Element Tab—Internal Frame Does Not Launch When the Element tab is selected and you double-click on a supported network element, an internal frame is not created or the content of an existing internal frame is not recycled. Defect Information—Collect the following information for further analysis: • CMSCclient.log file from the D:\Documents and Settings\\log directory. • Java Console information.
Appendix J Troubleshooting J.10.7 Configuration Center Management • Step 1 Results in the Operation Not Supported message box Determine if the drag-and-drop functionality is supported for the dropped object. The following objects can be dropped from the tree view to the content pane: • For the Element tab, the Network, Node, Card, Line, Port, IMA, and IMA link objects are supported and Folder objects are not supported.
Appendix J Troubleshooting J.10.7 Configuration Center Management Step 1 Determine if the drag-and-drop functionality is supported for the dropped object. The following objects can be dropped from the tree view to the content pane: • For the Element tab, the Network, Node, Card, Line, Port, IMA, and IMA link objects are supported and Folder objects are not supported. • For the Connection tab, the Node, Card, Line, and Port objects are supported and Folder, IMA and IMA link objects are not supported.
Appendix J Troubleshooting J.10.7 Configuration Center Management J.10.7.2 Configuration Center—Element Management The Configuration Center can be used to configure different network element objects. The Configuration Center's Element tab is the main window for creating, modifying, and viewing network elements. The Element tab uses the CTM Internal Frame mechanism to display the attributes (groups and categories) associated with a particular network element.
Appendix J Troubleshooting J.10.7 Configuration Center Management • Dspcd command output from the switch for the controller card and the service module where this error is detected. • Ddspln or dspport command output, if this error seen for a line or port. Possible alternative workaround—None. J.10.7.2.2 SNMP No Data Error An SNMP NO DATA error is seen while launching the Configuration Center (either by the drag-and-drop method or the right-click method) for a network element.
Appendix J Troubleshooting J.10.7 Configuration Center Management • Step 3 If the SNMP SET operation fails, SSH or Telnet to the CLI and try to add the element. If the operation succeeds, contact CTM engineers. If the Delete button is disabled, use any SNMP tool to delete the object using the SNMP SET operation. • If the SNMP SET operation passes, contact CTM engineers. • If the SNMP SET operation fails, SSH or Telnet to CLI and try to delete the element.
Appendix J Troubleshooting J.10.7 Configuration Center Management Step 3 If the file is not available, contact CTM engineers. Step 4 Open the document you got in step 2 and do the following: • Check the Access field of the MIB object in the XML file. • Check the Access field in the /opt/svplus/mibs directory. If the access field from XML file and MIB definition are not same, contact CTM engineers. Step 5 Check the Range field of the MIB object in the XML file and MIB definition.
Appendix J Troubleshooting J.10.7 Configuration Center Management Step 4 If the node or card is supported, open the /opt/svplus/log/CMSCclient.log file and check whether the FDN of the object being launched matches the information from Step 1. Contact CTM engineers with appropriate defect information.
Appendix J Troubleshooting J.10.8 Connection Management Problems • /opt/svplus/log/configserver.log Possible alternative workaround—None. J.10.7.2.8 Config Server Reports Error Messages This section describes the various kinds of errors that could happen on the config server. Step 1 Open the /opt/svplus/log/configserver.log file. Step 2 If data type mismatch occurs, an error message is displayed in the GUI and the corresponding error message seen in configserver.
Appendix J Troubleshooting J.10.8 Connection Management Problems Note • Note For connection management, the Configuration Center communicates with the Connection Management Server process. NE—Manages the nodes and their components. For network element management, the Configuration Center communicates with the Config Server process. The Configuration Center's Connection tab is the main window for creating, modifying, and viewing network connections.
Appendix J Troubleshooting J.10.8 Connection Management Problems Step 1 Determine if the drag-and-drop functionality is supported for the dropped object. The Connection tab supports the drag-and-drop functionality for the Node, Card, Line, and Port objects. The drag-and-drop functionality of Folder, IMA, and IMA link objects is not supported. Defect Information—Collect the following information for further analysis: • CMSCclient.log file under the D:\Documents and Settings\\log directory.
Appendix J Troubleshooting J.10.8 Connection Management Problems J.10.8.1.5 Advanced Mode Tab—Cannot Launch the Template Details Dialog Box Using the Template Details Button The Template Details button on the Advanced Mode tab fails to launch the Template Configuration dialog box. Defect Information—Collect the following information for further analysis: • CMSCclient.log file under the D:\Documents and Settings\\log directory.
Appendix J Troubleshooting J.10.8 Connection Management Problems • Configserver.log file under the /opt/svplus/log directory. Possible alternative workaround—None. J.10.8.1.
Appendix J Troubleshooting J.10.8 Connection Management Problems such cases, the problem must be researched on the CM Server side. The CM Server troubleshooting sections describe the steps required to further analyze the CM Server-related issues. See J.10.8 Connection Management Problems, page J-83. In this section, the required validation and data collection procedures related to the Configuration Center are presented. J.10.8.2.
Appendix J Troubleshooting J.10.8 Connection Management Problems Step 1 Verify that the CM Server and sdbroker are up and running by entering psg sdbroker and psg cmserver on the command line. Step 2 Verify if the CmServer restarted while the operation was being done by checking the cmsvr.log and searching for the string "START OF THE PROCESS". Verify that the time stamp of the server process was restarted while the operation was being performed.
Appendix J Troubleshooting J.10.8 Connection Management Problems • CMSCclient.log file under the D:\Documents and Settings\\log directory. • Java Console information; in particular, any Java-raised exceptions. • Screen snapshots; in particular, error/information messages dialog boxes. • Cmsvr.log file under the /opt/svplus/log directory. • Configserver.log file under the /opt/svplus/log directory. Possible alternative workaround—None. J.10.8.
Appendix J Troubleshooting J.10.8 Connection Management Problems J.10.8.3.2 Unsupported Service Type for the Foresight Connections for PNNI/SPVC Endpoints During connection addition, the error message could state "CM Server does not support Connection type[], Service type[], and Endtoend type []between Card type and []." The parentheses are filled with the appropriate values. Step 1 Determine if the service type is applicable to the endpoints.
Appendix J Troubleshooting J.10.8 Connection Management Problems Step 1 Determine what port header was used while creating the port in question. Then use ports with matching port headers to create the connection. Defect Information—Collect the cmsvr logs from the /opt/svplus/log directory. Possible alternative workaround—None. J.10.8.3.
Appendix J Troubleshooting J.10.8 Connection Management Problems J.10.8.3.8 Cmsvr—Connection Diagnostic Issues The cmsvr processes validates and services the connections provisioning requests from the CM GUI. During an add, modify, or delete connection request, the request is forwarded to the cmgrd process through an ILOG (IPC) request. If the request is for connection diagnostics such as testdelay or testconn (except conntrace), cmsvr sends it to the snmpcomm process for forwarding to the switch. J.10.
Appendix J Troubleshooting J.10.8 Connection Management Problems Note For any connection, if the local end of the connection does not support that particular diagnostic, cmsvr will verify if the diagnostic can be executed from the remote end. If the diagnostic is not supported by both endpoints of a connection, an appropriate error message will be given. J.10.8.3.10 Connection Up/Down/Reroute Failed Connection up/down/reroute diagnostic failed with a switch error.
Appendix J Troubleshooting J.10.8 Connection Management Problems • Capture selnd output • Copy all the cmsvr logs from /opt/svplus/logs directory • Copy all the cmgrd logs from /opt/svplus/logs directory • Capture the user_connection table query output from the CTM database for the given endpoint (if the request is not an addition request) • Switch CLI output for the trace diagnostics on the same connection Possible alternative workaround: a.
Appendix J Troubleshooting J.10.8 Connection Management Problems • J.10.8.4.14 Cmgrd—Addition Errors: Provisioning a Connection Results in "Vpi/vci ranges retrieval from svc_operation failed" Error, page J-102 • J.10.8.4.15 Cmgrd—Addition/Modification/Deletion Errors: Provisioning a Connection Results in "Can't get segment info from Data-base." Error, page J-103 • J.10.8.4.16 Cmgrd—Switch Errors, page J-103 • J.10.8.4.
Appendix J Troubleshooting J.10.8 Connection Management Problems • ConnProxy—The SNMP Agent Interface for Connection Management. • CmServer—Provides the backend functionality to the Connection Management GUI. • Cmgrd—The backend module, which accepts requests from ConnProxy, CmsServer Clients and issues the SNMP VarBinds to the switch for addition, modification, and deletion.
Appendix J Troubleshooting J.10.8 Connection Management Problems Defect Information: • If the sdbroker is processing many traps (more than 20 per second) during the time of the provisioning request, then there is no sdbroker defect. Investigate the switch, NTS, or EM if you feel that there should not be so many requests occurring at the given time. • If the sdbroker appears to be dormant, you need to capture the current status of the sdbroker.
Appendix J Troubleshooting J.10.8 Connection Management Problems Provisioning fails and the following error messages are displayed: • "No more vpi/vci available for local trunk end" and "Remote trunk" • "Local end of the connection already exists," "Remote end," and "Both end" • "Vpcon already exists for Local Vpi," "Remote Vpi," and "Both ends" Each of these error messages identifies the reason for the failure of provisioning. They sometimes can be displayed in error.
Appendix J Troubleshooting J.10.8 Connection Management Problems J.10.8.4.8 Cmgrd—Sdbroker Modification/Deletion Errors: Modifying or Deleting a Connection Results in "sDatabroker Could not lock connection entry." Error Related key index entries: cmgrd, sdbroker, lock connection During a modify or delete connection request, this error could result if sdbroker cannot find the connection in its cache. All scenarios of modify/delete connection failures display the same error.
Appendix J Troubleshooting J.10.8 Connection Management Problems • Use the RunConfigurator process to change the string in the CTM to match that of the switch. Defect Information—If these methods do not work, collect the following: • Cmgrd.log located in the /opt/svplus/cmgrd.log directory • The output of the query "select (*) from node_info where node_id = X" J.10.8.4.
Appendix J Troubleshooting J.10.8 Connection Management Problems The reason this error is returned is because cmgrd is still processing the initial request which the clients (CM GUI and Connection Proxy) timed out on. An ideal case for this would be when a switch timeout is received for a multisegment case, and cmgrd is still busy backing off other segments and waiting for the timeout response of additional segments. Just to be sure that cmgrd is still running, issue the following commands.
Appendix J Troubleshooting J.10.8 Connection Management Problems The reason for the error is that when cmgrd queries the svc_operation table for the feeder trunk port’s vpi and vci ranges, the entry is not found in the table. Step 1 Reissue the hybrid connection add request but tail the cmgrd.log. Step 2 In this log a query in the form of "SELECT MIN_SVCC_VPI, MAX_SVCC_VPI, MIN_SVCC_VCI, MAX_SVCC_VCI FROM SVC_OPERATION WHE RE NODE_ID = X AND SLOT = X AND PORT + 1 = X" will be seen.
Appendix J Troubleshooting J.10.8 Connection Management Problems When any add or modify connection request is issued, an SNMP VarBind is set on the switch via cmgrd. The switch can reject this VarBind with this error. The reason for the error is that cmgrd sent an invalid value for one of the MIB objects.
Appendix J Troubleshooting J.10.8 Connection Management Problems Step 3 On the CLI, execute the dsppnportrsrc command to check for the feeder trunk ports. Defect information—If you continue to receive this error after you have verified that the ports have enough bandwidth to add these connections, save the cmgrd.log. Possible alternative workaround—Freeing up resources on the port which needs the bandwidth to add the connection, or lowering the traffic parameters value in the connection request. J.10.
Appendix J Troubleshooting J.10.8 Connection Management Problems During an add or modify connection request, if the local endpoint’s remote parameters do not match the remote endpoint’s local parameters, then this error is indicated by the switch. The particular parameter depends on the service type of the connection. Note This error cannot be easily debugged.
Appendix J Troubleshooting J.10.9 Diagnostics Center Problems J.10.9 Diagnostics Center Problems The Diagnostics Center provides different diagnostics operations at the following different network elements levels. • Network Diagnostics – Retrieve the current sync status and alarm status of all the nodes in the network. – Support the network/node health statistics and manageability checks. At the network level, only the node manageability check results are supported.
Appendix J Troubleshooting J.10.
Appendix J Troubleshooting J.10.9 Diagnostics Center Problems • J.10.9.1.3 An Exception Is Raised when the Diagnostics Center Is Launched, page J-110 • J.10.9.1.4 Double-Click Operation In Diagnostics Center Tree View Does Not Launch an Internal Frame, page J-110 • J.10.9.1.5 Drag-and-Drop Functionality Errors Within the Diagnostics Center, page J-110 • J.10.9.1.6 Drag and Drop from/to Diagnostics Center to/from Other Applications, page J-111 • J.10.9.1.
Appendix J Troubleshooting J.10.9 Diagnostics Center Problems J.10.9.1.3 An Exception Is Raised when the Diagnostics Center Is Launched When the Diagnostics Center is launched using one of the following methods, an exception is raised and the Java Console shows the exception trace information. • Choose the target application under the Tools menu item. • Right-click on the selected object from the hierarchical tree, and choose the target application.
Appendix J Troubleshooting J.10.9 Diagnostics Center Problems • Cmsvr.log file under the /opt/svplus/log directory. • DCServer.log file under the /opt/svplus/log directory. Possible alternative workaround—None. J.10.9.1.6 Drag and Drop from/to Diagnostics Center to/from Other Applications As a drag source, the drag-and-drop functionality of an object from the Diagnostics Center to another CTM application fails to display the selected object in the target application.
Appendix J Troubleshooting J.10.9 Diagnostics Center Problems d. For the selected Java entry, check the Command column entry (If needed, expand the column to display all information) to determine if it is set to javaw.exe or java.exe. e. If the Command column setting is set to java.exe, then the Java DOS window is already enabled and a DOS window task should be running on the machine. Otherwise, the Java DOS window is not enabled (Command column entry is set to javaw.exe).
Appendix J Troubleshooting J.10.9 Diagnostics Center Problems J.10.9.2.1 XML Parser Error The XML parsing error is seen while launching the Diagnostics Center (either by the drag-and-drop method or the right-click method) for a network element. The popup window says "Internal Error: XML Parsing Error." Step 1 Verify whether the entity (node, card, line, or port) that caused this error is supported in the CTM version being used. If this error is seen for a supported node/card, go to step 2.
Appendix J Troubleshooting J.10.9 Diagnostics Center Problems Step 2 If the node is reachable then check whether the community strings are set properly. Step 3 Check the DCServer.log file to determine whether the community string used for querying the objects is set correctly. Step 4 Check whether the query has been sent to the switch. Defect Information—Collect the following information for further analysis: • CMSClient.log file under the D:\Documents and Settings\\log directory.
Appendix J Troubleshooting J.10.9 Diagnostics Center Problems Step 3 Use any SNMP tool and check whether the MIB objects are retrievable. Step 4 Narrow down the problem by selecting one counter at a time and determining for which counters the polling fails. Defect Information—Collect the following information for further analysis: • DCServer.log file from /opt/svplus/log directory. • Screen snapshots; in particular, error/information messages dialog boxes.
Appendix J Troubleshooting J.10.9 Diagnostics Center Problems Defect Information—Collect the following information for further analysis: • DCServer.log file from /opt/svplus/log directory. • Screen snapshots; in particular, the Diagnostics Center BERT window, error/information messages dialog boxes. Possible alternative workaround—Use the CLI/DiagProxy for BERT operations. J.10.9.2.
Appendix J Troubleshooting J.10.10 Performance Management Collection and Parsing Problems J.10.9.2.10 Miscellaneous Issues or Problems in Diagnostics Center If you encounter any other issues or problems, contact the CTM engineers with the defect information. Step 1 Check whether a similar operation can be performed successfully through the CLI. Defect Information—Collect the following information for further analysis: • Describe the operation during which the problem/issue was encountered.
Appendix J Troubleshooting J.10.10 Performance Management Collection and Parsing Problems • Check the collsvr_err_log table for any failure during start/stop collection. • Check the coll_err_log table for entire collection server errors. • Check '/opt/svplus/cache/scm/scmcollout.log' for a completed stats file request. • Check '/opt/svplus/cache/scm/scmcollin.log' to verify whether or not stats file has been completed. • Check '/opt/svplus/cache/scm/scmcollout.
Appendix J Troubleshooting J.10.10 Performance Management Collection and Parsing Problems echo "select fc_state, fc_type, slot from card where node_id = and slot = " | dbaccess • Related key index entries • Pmcollector Possible alternative workaround—If the card is not in fc_state 3, look up troubleshooting for the EM module. J.10.10.1.
Appendix J Troubleshooting J.10.10 Performance Management Collection and Parsing Problems J.10.10.1.6 PM Collection Fails for the Node—Log File Shows "Ftp failed" This could happen for various reasons; generally, it is because of an incorrect username/password or a timeout. Step 1 Check the node_id, node_name, and IP address in the node_info table and make sure they are the correct ones. Step 2 Check the type of IP routing used while starting collection.
Appendix J Troubleshooting J.10.11 Statistics Report Problems J.10.10.2 PM Parsing Issues This section includes the following information: • J.10.10.2.1 StatsParser—Generic Troubleshooting, page J-121 • J.10.10.2.2 StatsParser—Files Are Parsed But the Files Are Listed in the BadFileList, page J-121 J.10.10.2.1 StatsParser—Generic Troubleshooting StatsParser reads the data from the stat files and inserts the data into the database.
Appendix J Troubleshooting J.10.11 Statistics Report Problems • J.10.11.3 You Generated a Report but Do Not See Data for a Long Time, page J-122 • J.10.11.4 You See FDNs for Other Entities when You Generate a Report, page J-122 • J.10.11.5 You See the Wrong FDN for a Raw Report, page J-122 • J.10.11.6 Utilization Report Value Is Greater than 100%, page J-123 J.10.11.1 Statistics Report You can use the Statistics Report to view reports of statistics data that are collected from the switch.
Appendix J Troubleshooting J.10.12 Service Agent Problems This is an error on the server while forming FDN. Defect Information—Collect the following information for further analysis: • /opt/svplus/log/srtserver.log Possible alternative workaround—None. J.10.11.6 Utilization Report Value Is Greater than 100% The Utilization report value is greater than 100%. This is an error. Defect Information—Collect the following information for further analysis: • /opt/svplus/log/srtserver.
Appendix J Troubleshooting J.10.12 Service Agent Problems J.10.12.1.1 Registration with RtmProxy Failed Manager's SNMP request to register with RtmProxy returned an error. Step 1 Verify that the CTM core is up and running by executing ps -ef | grep RtmProxy on the CTM machine. Step 2 Verify that the snmpset request was sent to port 8161. Step 3 Verify that the community string for the snmpset is set to private. Step 4 Verify that the MIB objects that are being set are correct.
Appendix J Troubleshooting J.10.12 Service Agent Problems J.10.12.1.3 Manager Gets Deregistered The Manager is deregistered from RtmProxy after running for a while. Step 1 Verify that the keepalive script is running. The Manager will automatically get deregistered if no SNMP is done on any of the tables in RtmProxy.
Appendix J Troubleshooting J.10.13 Miscellaneous Problems This section includes the following information: • J.10.12.2.1 AuditLogger.conf Usage, page J-126 • J.10.12.2.2 Audit Trail Log File Naming Convention, page J-126 • J.10.12.2.3 When You Open a Dialog Box in a CTM GUI, There Is No Record in the Audit Trail Log File, page J-126 J.10.12.2.1 AuditLogger.conf Usage The following can be configured in the configuration file: • Location of the log file—The default is (/opt/svplus/log/AL).
Appendix J Troubleshooting J.10.13 Miscellaneous Problems • J.10.13.2 Data Inconsistency, page J-129 • J.10.13.3 CTM FTP Daemon, page J-134 J.10.13.1 NTS This section includes the following information: • J.10.13.1.1 Nodes Stay in Mode 1 After ColdStart, page J-127 • J.10.13.1.2 Config Change or Provisioning Activity Not Reflected on CTM, page J-127 • J.10.13.1.3 How To Interpret NTS Log, page J-128 J.10.13.1.
Appendix J Troubleshooting J.10.13 Miscellaneous Problems Step 1 See if the node is in OK state. If the ntsControl node information says the particular node is not in the OK state, see J.10.13.2.1 Connection Inconsistency Between the Switch and GUI, page J-129. If the node is indeed in OK state, go to step 2. Step 2 Check the Trap IP address setting on the switch. The Trap IP address has to be the primary IP address of the switch.
Appendix J Troubleshooting J.10.13 Miscellaneous Problems In that case, it prints the IP address only and throw it away. Defect Information—None. Possible alternative workarounds—None. Related key index entries: nts, log J.10.13.2 Data Inconsistency This section includes the following information: • J.10.13.2.1 Connection Inconsistency Between the Switch and GUI, page J-129 • J.10.13.2.2 Inconsistent Connection Status, page J-132 • J.10.13.2.
Appendix J Troubleshooting J.10.13 Miscellaneous Problems Note a. All ports in the database and the messages are 0-based, and all ports on the switch CLI are 1-based. Therefore, if the switch shows port 3, then you should query for port 2. Query the user_connection table for one of the connections in question.
Appendix J Troubleshooting J.10.13 Miscellaneous Problems Remote node 11 ....—The remote endpoint. MsgType=100—The message type.
Appendix J Troubleshooting J.10.13 Miscellaneous Problems The cache dump will be written to a file in /opt/svplus/log/sdbkrCache.dump. Verify if the connection in question is correct in the cache. Defect Information—You need the logs of the processes on both sides of the interface on which the message was dropped. A dump of the specific user_connection table entry that is incorrect is also useful as well as the segment tables for this connection.
Appendix J Troubleshooting J.10.13 Miscellaneous Problems • 2 = fail The bit pattern is: Step 1 • Bits 1, 2—Local abit • Bit 2, 4—Local AIS • Bit 5, 6—Local OAM • Bit 7, 8—Local Conditioned • Bit 9, 10—Remote abit • Bit 11, 12—Remote AIS • Bit 13, 14—Remote OAM • Bit 15, 16—Remote Conditioned If the value is not what is expected, check the connection level databases for each segment to see if they are correct. See J.10.13.2.
Appendix J Troubleshooting J.10.13 Miscellaneous Problems J.10.13.3 CTM FTP Daemon This section includes the following information: • J.10.13.3.1 FTP Daemon Overview, page J-134 • J.10.13.3.2 Generic Troubleshooting, page J-134 • J.10.13.3.3 FTP Username and Password, page J-134 • J.10.13.3.4 cwmftpd—Files Are Not Transferred Due to Wrong Username/Password, page J-135 • J.10.13.3.5 cwmftpd—File Not Available On Switch, page J-135 • J.10.13.3.6 FTP Sessions in Switch, page J-135 • J.10.13.3.
Appendix J Troubleshooting J.10.13 Miscellaneous Problems J.10.13.3.4 cwmftpd—Files Are Not Transferred Due to Wrong Username/Password Files are not transferred between CTM and the switch or between CTMs due to a wrong username/password. The files are not FTP'd between the switch and CTM or between CTMs due to a wrong FTP username/password. Step 1 Check whether the FTP username and password are correct. Step 2 Check whether cwmftpd.
Appendix J Troubleshooting J.10.13 Miscellaneous Problems The switch will reserve the session for the CTM station for 30 seconds before it services other stations. CTMftpd will retrieve multiple files within a single FTP session. A maximum limit per session will be imposed. This feature is supported in CTM with MGX 8850 Release 4.0 or later. For Switch Software (SWSW) earlier than MGX 8850 Release 4.0, the switch responds with "421 Session limit reached, closing control connection.
Appendix J Troubleshooting J.10.13 Miscellaneous Problems J.10.13.3.9 Failed to Acquire a Session with a Switch For MGX 8850 Release 4.0 or later, CTM waits in a predefined port to acquire the session, if it receives the "499 Session limit reached" error. This wait time is 1 minute by default and is configurable.
Appendix J Troubleshooting J.10.13 Miscellaneous Problems • TRANSFER_RETRY—Specifies that the transfer request needs to be retried. • TRANSFER_FAILED—Specifies that cwmftpd was unable to transfer the file. • CONTROL_CONN_TIMEOUT—This exception will be thrown where there is no transfer of information for X seconds once the FTP session is opened. Related key index entries: FTP log Cisco Transport Manager Release 6.