
Network Router User Manual

A-19
Cisco 7304 Router MIB Specifications Guide
OL-4925-02
Appendix A Using MIBs
Monitoring Quality of Service
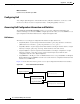
Note the following about the sample QoS configuration:
• Policy maps that are not attached to an interface are not included with SNMP data or displayed by
the show policy-map interface command. This is why pm-1Meg is shown but pm1 is not.
• The default class map is always included with the SNMP data.
• Class maps that have no action defined are not included with the SNMP data.
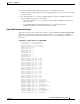
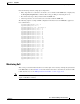
The following output is a sample of RED configuration information stored in MIB tables applied to a
Cisco 7304 interface.
cbQosREDCfgExponWeight.9776 = 10
cbQosREDCfgMeanQsize.9776 = 0
cbQosREDCfgDscpPrec.9776 = precedence(1)
cbQosREDCfgMinThreshold.9776.0 = 10
cbQosREDCfgMinThreshold.9776.1 = 11
cbQosREDCfgMinThreshold.9776.2 = 12
cbQosREDCfgMinThreshold.9776.3 = 13
cbQosREDCfgMinThreshold.9776.4 = 14
cbQosREDCfgMinThreshold.9776.5 = 15
cbQosREDCfgMinThreshold.9776.6 = 16
cbQosREDCfgMinThreshold.9776.7 = 17
cbQosREDCfgMaxThreshold.9776.0 = 126
cbQosREDCfgMaxThreshold.9776.1 = 126
cbQosREDCfgMaxThreshold.9776.2 = 126
cbQosREDCfgMaxThreshold.9776.3 = 126
cbQosREDCfgMaxThreshold.9776.4 = 126
cbQosREDCfgMaxThreshold.9776.5 = 126
cbQosREDCfgMaxThreshold.9776.6 = 126
cbQosREDCfgMaxThreshold.9776.7 = 126
cbQosREDCfgPktDropProb.9776.0 = 10
cbQosREDCfgPktDropProb.9776.1 = 10
cbQosREDCfgPktDropProb.9776.2 = 10
cbQosREDCfgPktDropProb.9776.3 = 10
cbQosREDCfgPktDropProb.9776.4 = 10
cbQosREDCfgPktDropProb.9776.5 = 10
cbQosREDCfgPktDropProb.9776.6 = 10
cbQosREDCfgPktDropProb.9776.7 = 10
. . .
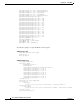
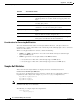
Monitoring QoS
This section provides information about how to monitor QoS on the router by checking the QoS statistics
in the MIB tables described in Table A-4. For information about how to determine the amount of traffic
to bill customers for, see the “Billing Customers for Traffic” section on page A-24.
Note The CISCO-CLASS-BASED-QOS-MIB might contain more information than what is displayed in the
output of CLI show commands.