
User's Guide

Navini Networks, Inc. Ripwave MX PC Card (PMX) User’s Guide
The Trend Analysis
Screen, continued
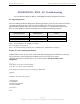
The Statistics
Screen
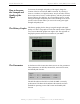
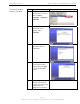
By pressing the Plot Graph button, the following screen appears.
This screen displays the value of the selected parameters over the
last five minutes, updated once every second. The graphic scrolls
from right to left.
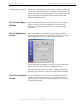
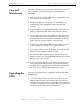
The Statistics screen lets you view the current value of selected
parameters. These values are updated as they change over time. To
view the Statistics screen, press the Statistics button.
Page 23
060815_pv1.1_Ripwave MX PC Card (PMX) User’s Guide_40-00460-00Ra(4.5)