
User's Guide

Navini Networks, Inc. Ripwave MX PC Card (PMX) User’s Guide
The Signal
Strength and
Signal Quality
Bars
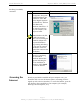
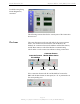
Signal Strength and Signal Quality are dynamic bar areas that
indicate how well your PMX is receiving signals from the Base
Station.
In particular, the Signal Strength bar area graphically represents the
strength of the synchronization signal your Modem is receiving
from BTS. The strength of the signal is represented by a group of
colored bars. The higher the pile of bars goes, the stronger the
signal is. The color of the bars also gives an indication of the
strength of the signal. Green lines indicate an excellent signal.
Orange lines indicate a good signal while red lines indicate a weak
signal.
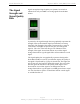
The Signal Quality bar area graphically represents the Signal-to-
Noise Ratio (SNR) received by your Modem. Again, the quality of
the signal is represented by a group of colored bars. The higher the
pile of bars goes, the better the SNR of the signal. The color of the
bars also gives an indication of the quality of the signal. Green
lines indicate an excellent signal or an SNR greater than 21.
Orange lines indicate a good signal or an SNR greater than or equal
to 13 but less than or equal to 21. Red lines indicate a weak signal
or an SNR less than 13.
Page 20
060815_pv1.1_Ripwave MX PC Card (PMX) User’s Guide_40-00460-00Ra(4.5)