
User Manual
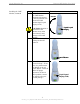
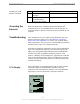

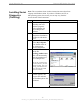
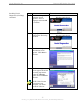
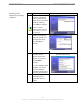


Table Of Contents
- Permissions, Trademarks & Distribution
- Safety
- Regulatory Information
- Introduction
- Package Inventory
- LMX Models
- Minimum Computing Requirements
- Physical Characteristics
- Installing the LMX Modem
- Accessing the Internet
- Troubleshooting
- Installing Navini Diagnostics (NavDiag)
- Troubleshooting Using Navini Diagnostics (NavDiag)
- Uninstalling Navini Diagnostics (NavDiag)
- Optional Batteries
- Optional External Battery Packs
- Connecting the Standard External Battery Pack (S-EBP)
- The Indicator Light on the Standard External Battery Pack (S
- Charging the Standard External Battery Pack (S-EBP)
- Connecting and Disconnecting the Heavy Duty External Batter
- The Indicator Light on the Heavy Duty External Battery Pack
- Charging the Heavy Duty External Battery Pack (HD-EBP)
- Care & Maintenance
- Upgrading the Modem
- ADDENDUM 1: Ripwave™-MX Modem - PC Troubleshooting
- ADDENDUM 2: End User Software License Agreement

Navini Networks, Inc. Ripwave-MX Modem User Guide
Troubleshooting Using
Navini Diganostics
(NavDiag), continued
The Signal Quality bar area graphically represents the Signal-to-
Noise Ratio (SNR) of the downlink access code channel (ACC)
received by the Modem. Again, the quality of the signal is
represented by a group of colored bars. The higher the pile of
goes, the better the SN
bars
R of the signal. The color of the bars also
ives an indication of the quality of the signal. Green lines indicate
n excellent signal or an SNR greater than 21. Orange lines
dicate a good signal or an SNR greater than or equal to 13 but
ss than or equal to 21. Red lines indicate a weak signal or an SNR
ss than 13.
o
ther wireless devices (microwave
vens, cordless phones), and away from metal objects (shelves, file
abinets). As the LMX Modem is repositioned, observe the Signal
trength and Signal Quality bars. Position the Modem for
aximum signal strength and quality.
he History graphs plot the change in signal strength and signal
t the bottom of the Connection Status screen, are four parameters.
hese parameters are BTS ID, Network ID, Active SW Version,
nd Standby SW Version. The BTS ID and Network ID indicate
e BTS to which the Modem is currently synchronized and the
etwork in which the Modem is operating. Active SW Version and
tandby SW Version indicate the version number of the software
g
a
in
le
le
To increase the strength and quality of the signal, change the
location of the LMX Modem. Try moving it closer to a window, t
a higher location, away from o
o
c
S
m
T
quality over time. The graphs cover the last minute and are updated
every second. Read the graphs from right to left. The right side of
the graph represents the most recent status of your Modem.
A
T
a
th
n
S
19
051123_pv1.3_Ripwave-MX Modem User Guide_40-00382-00b(prelim4.4.2)