
User Manual
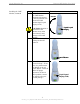
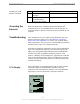

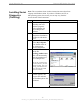
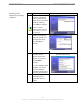


Table Of Contents
- Permissions, Trademarks & Distribution
- Safety
- Regulatory Information
- Introduction
- Package Inventory
- LMX Models
- Minimum Computing Requirements
- Physical Characteristics
- Installing the LMX Modem
- Accessing the Internet
- Troubleshooting
- Installing Navini Diagnostics (NavDiag)
- Troubleshooting Using Navini Diagnostics (NavDiag)
- Uninstalling Navini Diagnostics (NavDiag)
- Optional Batteries
- Optional External Battery Packs
- Connecting the Standard External Battery Pack (S-EBP)
- The Indicator Light on the Standard External Battery Pack (S
- Charging the Standard External Battery Pack (S-EBP)
- Connecting and Disconnecting the Heavy Duty External Batter
- The Indicator Light on the Heavy Duty External Battery Pack
- Charging the Heavy Duty External Battery Pack (HD-EBP)
- Care & Maintenance
- Upgrading the Modem
- ADDENDUM 1: Ripwave™-MX Modem - PC Troubleshooting
- ADDENDUM 2: End User Software License Agreement

Navini Networks, Inc. Ripwave-MX Modem User Guide
051123_pv1.3_Ripwave-MX Modem User Guide_40-00382-00b(prelim4.4.2)
sing
continued
sent the PC, the co een the PC and the
em ction betwee
Base Station, and the Base Station to which the Modem is
commu rks over the connections indicate
working connections.
If the connection between the PC and the Modem or between the
odem and the Base Station is interrupted, an “X” is positioned
ver the corresponding icon.
The Signal Strength and Signal Quality are dynamic bar areas that
dicate how well your Modem is receiving signals from the Base
ceived by the Modem. The strength of the signal is
represented by a group of colored bars. The higher the pile of bars
goes, the stronger the signal is. The color of the bars also gives an
indication of the strength of the signal. Green lines indicate an
excellent signal. Orange lines indicate a good signal while red lines
indicate a weak signal.
Troubleshooting U
Navini Diagnostics
(NavDiag),
The icons repre nnection betw
Mod , the Modem, the conne
nicating. Check ma
n the Modem and the
M
o
in
Station. In particular, the Signal Strength bar area graphically
represents the strength of the Absolute BTS Synchronization
Signal re
18