
Instruction Manual
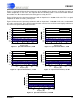
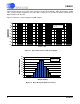
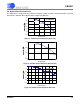
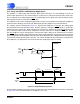
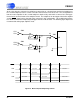

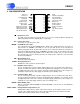
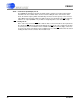
Table Of Contents
- Features & Description
- General Description
- Table of Contents
- List of Figures
- List of Tables
- 1. Characteristics and Specifications
- 2. Overview
- 3. Theory of Operation
- 3.1 Converter Operation
- 3.2 Clock
- 3.3 Voltage Reference
- 3.4 Analog Input
- 3.5 Output Coding Format
- 3.6 Typical Connection Diagrams
- 3.7 AIN & VREF Sampling Structures
- 3.8 Converter Performance
- 3.9 Digital Filter Characteristics
- 3.10 Serial Port
- 3.11 Power Supplies & Grounding
- 3.12 Using the CS5581 in Multiplexing Applications
- 3.13 Synchronizing Multiple Converters
- 4. Pin Descriptions
- 5. Package Dimensions
- 6. Ordering Information
- 7. Environmental, Manufacturing, & Handling Information
- 8. Revision History
CS5581
DS796PP1 21
3/25/08
14:34
Figures 11 through 16 illustrate the performance of the CS5581 when driven by a 5.55 kHz sine wave at
various amplitudes. In each case, the captured data was windowed with a seven-term window function
that exhibits 4.3 dB of attenuation before being processed by the FFT.
Figure 14 illustrates the converter performance with an input that is 1/10,000 of full scale. This is a signal
magnitude of about 6.5 codes, peak to peak.
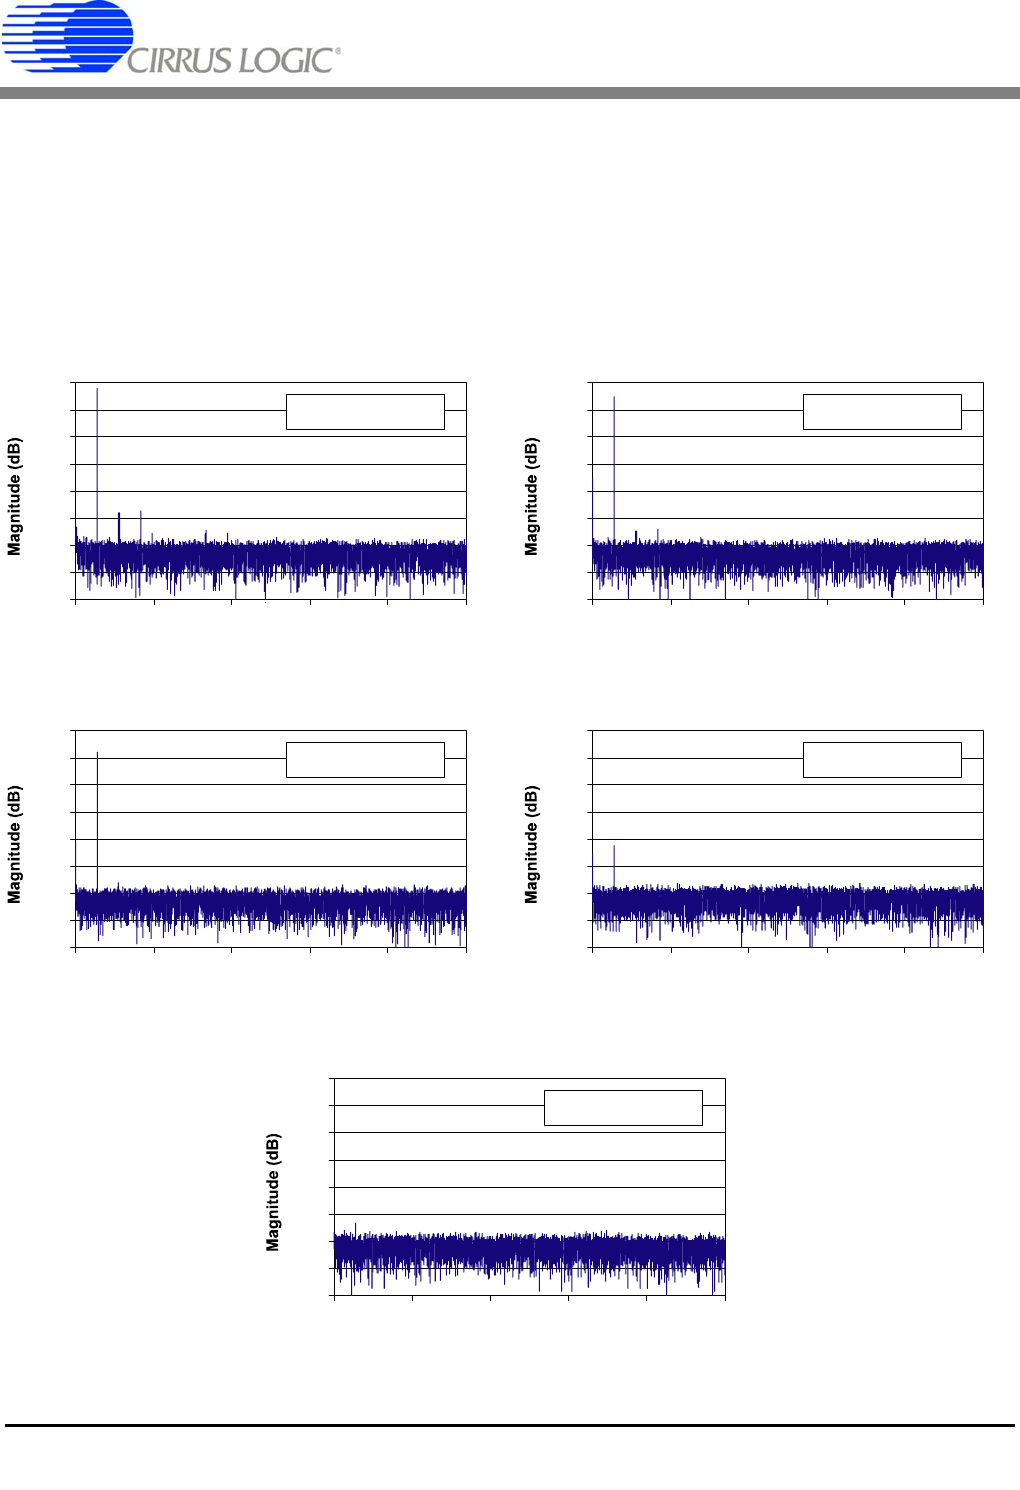
Figure 15 illustrates the converter performance with an input that is 1/100,000 of full scale, or about 0.65
of a code, peak to peak. These plots illustrate that this converter has excellent small-signal performance
due to the near-perfect DNL of the converter.
-160
-140
-120
-100
-80
-60
-40
-20
0
0 20k 40k 60k 80k 100k
Frequency (Hz)
5.55 kHz, 0 dB
32k Samples @ 200 kSps
-160
-140
-120
-100
-80
-60
-40
-20
0
0 20k 40k 60k 80k 100k
Frequency (Hz)
5.55 kHz, -6 dB
32k Samples @ 200 kSps
-160
-140
-120
-100
-80
-60
-40
-20
0
0 20k 40k 60k 80k 100k
Frequency (Hz)
5.55 kHz, -80 dB
32k Samples @ 200 kSps
-160
-140
-120
-100
-80
-60
-40
-20
0
0 20k 40k 60k 80k 100k
Frequency (Hz)
5.55 kHz, -12 dB
32k Samples @ 200 kSps
-160
-140
-120
-100
-80
-60
-40
-20
0
0 20k 40k 60k 80k 100k
Frequency (Hz)
5.55 kHz, -100 dB
32k Samples @ 200 kSps
Figure 11. Spectral Performance, 0 dB Figure 12. Spectral Performance, -6 dB
Figure 13. Spectral Performance, -12 dB Figure 14. Spectral Performance, -80 dB
Figure 15. Spectral Performance, -100 dB