
User guide

CDB5550
14
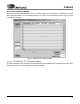
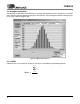
2.5 Histogram Information
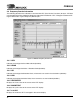
The following is a description of the indicators associated with Histogram Analysis. Histograms can be plot-
ted in the Data Collection Window by setting the Time Domain / FFT / Histogram selector to Histogram. Fig-
ure 9 shows a typical histogram plot.
Figure 9. CDB5550 Histogram Plot
2.5.1 MEAN
Indicator for the mean of the data sample set. The mean is calculated using the following formula:
Σ
n - 1
i = 0
n
Mean =
X
i