
Instruction Manual


130 DS882F1
CS42L73
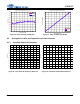
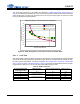
8.3.1.2 Group Delay
The group-delay equations for the ASRCs are specified in “ASRC Digital Filter Characteristics” on
page 25. The following chart illustrates, for the extreme supported internal sample rates (Fs) and standard
audio sample rates, the input (from the serial ports to the core) and output (from the core to the serial
ports) group delays through the ASRCs.
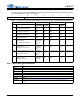
8.3.1.3 Lock Time
The following table outlines the ASRC lock times for the extremes of the standard audio serial port sample
rates for all sample rate programming configurations and directions. If the table asks if the serial port sam-
ple rate has been programmed, it is asking if registers “XSP Sample Rate” on page 93, “ASP Sample
Rate” on page 90, and/or “VSP Sample Rate” on page 93 (whichever are applicable) have been properly
programmed (vs. being set to “don’t know”) before the ASRC attempts to lock.
Table 15. ASRC Lock Times
Serial Port Sample Rate
Programmed (Y/N)?
ASRC Direction
Serial Port Sample Rate (kHz) ASRC Lock Time
(ms)
YAnyAny 19
N From core to serial port 8 93
N4811
N From serial port to core 8 63
N4843
ASRC Group Delay vs. Serial Port and Internal Sample Rates
0.00
0.10
0.20
0.30
0.40
0.50
0.60
0.70
0.80
0.90
1.00
0.0 10.0 20.0 30.0 40.0 50.0
Serial Port Sample Rate (kHz)
Group Delay Through ASRC (ms)
Input, Fs = 44.1 kHz
Input, Fs= 50.781 kHz
Output, Fs = 44.1 kHz
Output, Fs = 50.781 kHz
Figure 55. ASRC Group Delay vs. Serial Port and Internal Sample Rates