
Instruction Manual

16 DS773F1
CS42L55
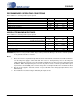
ANALOG PASSTHROUGH CHARACTERISTICS
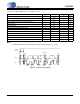
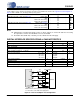
Test Conditions (unless otherwise specified): Connections to the CS42L55 are shown in the “Typical Connection Diagram” on
page 10; Input is a 1 kHz sine wave through the passive input filter shown in Figure 1, PGA and HP/Line gain = 0 dB; All Sup-
plies = VA, VCP Mode; GND = AGND = 0 V; T
A
= +25 °C; Measurement bandwidth is 20 Hz to 20 kHz. Sample Frequency =
48 kHz.
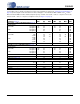
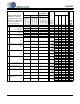
COMBINED DAC INTERPOLATION & ON-CHIP ANALOG FILTER RESPONSE
Notes:
15. Response is clock dependent and will scale with Fs. Note that the response plots (Figures 31 to 34 on
page 70) have been normalized to Fs and can be de-normalized by multiplying the X-axis scale by Fs.
16. Measurement bandwidth is from Stopband to 3 Fs.
VA = 2.5 V VA = 1.8 V
Parameter
Min Typ Max Min Typ Max Unit
Analog In to HP Amp (ADC is powered down)
R
L
= 3 kΩ (+2 dB Output Analog Gain)(Note 12)
Dynamic Range A-weighted
unweighted
-
-
94
91
-
-
-
-
91
88
-
-
dB
dB
Total Harmonic Distortion + Noise -1 dB
-20 dB
-60 dB
-
-
-
-70
-71
-31
-
-
-
-
-
-
-80
-68
-28
-
-
-
dB
dB
dB
Full-scale Input Voltage
- 0.80•VA - - 0.80•VA - Vpp
Full-scale Output Voltage
- 0.93•VA - - 0.93•VA - Vpp
Passband Ripple
0/-0.3 0/-0.3 dB
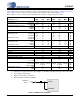
R
L
= 16 Ω (-4 dB Output Analog Gain)(Note 12)
Dynamic Range A-weighted
unweighted
-
-
94
91
-
-
-
-
91
88
-
-
dB
dB
Total Harmonic Distortion + Noise -1 dB
-20 dB
-60 dB
-
-
-
-70
-71
-31
-
-
-
-
-
-
-80
-68
-28
-
-
-
dB
dB
dB
Full-scale Input Voltage
- 0.80•VA - - 0.80•VA - Vpp
Output Power (Note 13)
-12--6.5-mW
Passband Ripple
- 0/-0.3 - - 0/-0.3 - dB
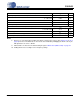
Analog In to Line Amp (ADC is powered down)
R
L
= 3 kΩ (+2 dB Output Analog Gain) (Note 12)
Dynamic Range A-weighted
unweighted
-
-
94
91
-
-
-
-
91
88
-
-
dB
dB
Total Harmonic Distortion + Noise -1 dB
-20 dB
-60 dB
-
-
-
-70
-71
-31
-
-
-
-
-
-
-80
-68
-28
-
-
-
dB
dB
dB
Full-scale Input Voltage
- 0.80•VA - - 0.80•VA - Vpp
Full-scale Output Voltage
- 0.89•VA - - 0.89•VA - Vpp
Passband Ripple
0/-0.3 0/-0.3 dB
Parameter (Note 15) Min Typ Max Unit
Frequency Response 20 Hz to 20 kHz Fs = 48.000 kHz
Fs = 44.118 kHz
-0.04
-0.14
-
-
+0.04
+0.14
dB
dB
Passband to -0.05 dB corner
to -3 dB corner
-
-
0.48
0.49
-
-
Fs
Fs
Stopband
0.55 - - Fs
Stopband Attenuation (Note 16)
49 - - dB
Total Group Delay
-9/Fs -s
De-emphasis Error Fs = 44.118 kHz
- - +0.05/-0.25 dB