
User Manual


Table Of Contents
- Features
- Table of Contents
- List of Figures
- 1. Hardware
- 2. Software
- 2.1 Installation Procedure
- 2.2 Using the Software
- 2.3 Start-up Window
- 2.4 Connect Menu
- 2.5 System Menu
- 2.5.1 Setup Window
- 2.5.1.1 Refresh Screen Button
- 2.5.1.2 Reset DUT Button
- 2.5.1.3 Save Config and Load Config Buttons
- 2.5.1.4 CS5480 MCLK Frequency
- 2.5.1.5 Configuration Registers
- 2.5.1.6 Pulse Control Register
- 2.5.1.7 Pulse Width and Pulse Rate Registers
- 2.5.1.8 Phase Compensation
- 2.5.1.9 Integrator Gain, System Gain
- 2.5.1.10 Sample Count, Cycle Count, Settle Time
- 2.5.1.11 Epsilon
- 2.5.1.12 ZXNUM
- 2.5.1.13 Mask Register
- 2.5.1.14 Temperature Registers
- 2.5.1.15 Zero-crossing Level and No Load Threshold
- 2.5.1.16 V1/V2 Sag, V1/ V2 Swell, and I1/I2 Overcurrent Registers
- 2.5.1.17 Channel Selection Level, Channel Select Minimum Amplitude, and Voltage Fixed RMS Reference Registers
- 2.5.1.18 Register Checksum, SerialCtrl Registers
- 2.5.1 Setup Window
- 2.6 Calibration Window
- 2.7 Conversion Window
- 2.8 Cirrus Test Window
- 2.8.1 Data Collection Window
- 2.8.1.1 Time Domain / FFT/ Histogram Selector
- 2.8.1.2 Config Button
- 2.8.1.3 Collect Button
- 2.8.1.4 Output Button
- 2.8.1.5 Zoom Button
- 2.8.1.6 Channel Select Button
- 2.8.1.7 Output Button & Window
- 2.8.1.8 Configuration Window
- 2.8.1.9 Collecting Data Sets
- 2.8.1.10 Analyzing Data
- 2.8.1.11 Histogram Information
- 2.8.1.12 Frequency Domain Information
- 2.8.1.13 Time Domain Information
- 2.8.2 Data Collection to File Window
- 2.8.3 Setup and Test Window
- 2.8.1 Data Collection Window
- Appendix A. Bill Of Materials
- Appendix B. Schematics
- Appendix C. Layer Plots
CDB5480U
DS893DB5 33
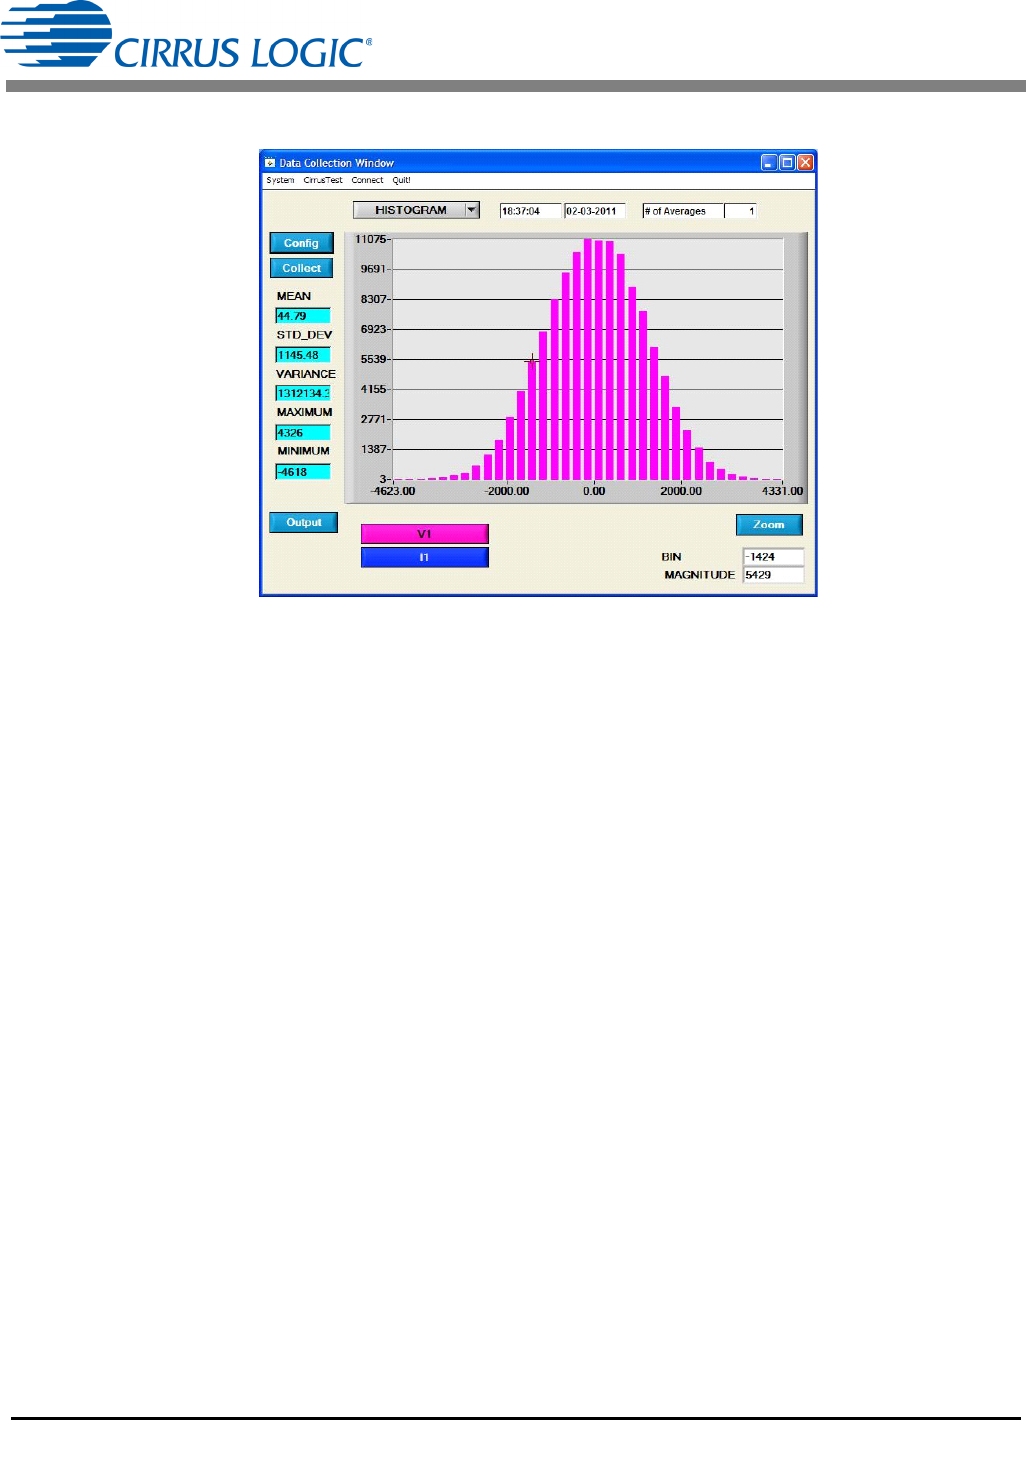
• MINIMUM: indicates the minimum value of the collected data set.
Figure 27. Histogram Analysis
2.8.1.12 Frequency Domain Information
The following describe the indicators associated with FFT (Fast-Fourier Transform) analysis. FFT data
can be plotted in the Data Collection window by setting the analysis type selector to FFT. See Figure 28.
The FFT information includes:
• FREQUENCY: displays the x-axis value of the cursor on the FFT display.
• MAGNITUDE: displays the y-axis value of the cursor on the FFT display.
• S/PN: indicates the signal-to-peak noise ratio (decibels).
• SINAD: indicates the signal-plus-noise-plus-distortion to noise-plus-distortion ratio (decibels).
• S/D: indicates the signal-to-distortion ratio, 4 harmonics are used in the calculations (decibels).
• SNR: indicates the signal-to-noise ratio, first 4 harmonics are not included (decibels).