
User Manual


Table Of Contents
- Features
- Table of Contents
- List of Figures
- 1. Hardware
- 2. Software
- 2.1 Installation Procedure
- 2.2 Using the Software
- 2.3 Start-up Window
- 2.4 Connect Menu
- 2.5 System Menu
- 2.5.1 Setup Window
- 2.5.1.1 Refresh Screen Button
- 2.5.1.2 Reset DUT Button
- 2.5.1.3 Save Config and Load Config Buttons
- 2.5.1.4 CS5480 MCLK Frequency
- 2.5.1.5 Configuration Registers
- 2.5.1.6 Pulse Control Register
- 2.5.1.7 Pulse Width and Pulse Rate Registers
- 2.5.1.8 Phase Compensation
- 2.5.1.9 Integrator Gain, System Gain
- 2.5.1.10 Sample Count, Cycle Count, Settle Time
- 2.5.1.11 Epsilon
- 2.5.1.12 ZXNUM
- 2.5.1.13 Mask Register
- 2.5.1.14 Temperature Registers
- 2.5.1.15 Zero-crossing Level and No Load Threshold
- 2.5.1.16 V1/V2 Sag, V1/ V2 Swell, and I1/I2 Overcurrent Registers
- 2.5.1.17 Channel Selection Level, Channel Select Minimum Amplitude, and Voltage Fixed RMS Reference Registers
- 2.5.1.18 Register Checksum, SerialCtrl Registers
- 2.5.1 Setup Window
- 2.6 Calibration Window
- 2.7 Conversion Window
- 2.8 Cirrus Test Window
- 2.8.1 Data Collection Window
- 2.8.1.1 Time Domain / FFT/ Histogram Selector
- 2.8.1.2 Config Button
- 2.8.1.3 Collect Button
- 2.8.1.4 Output Button
- 2.8.1.5 Zoom Button
- 2.8.1.6 Channel Select Button
- 2.8.1.7 Output Button & Window
- 2.8.1.8 Configuration Window
- 2.8.1.9 Collecting Data Sets
- 2.8.1.10 Analyzing Data
- 2.8.1.11 Histogram Information
- 2.8.1.12 Frequency Domain Information
- 2.8.1.13 Time Domain Information
- 2.8.2 Data Collection to File Window
- 2.8.3 Setup and Test Window
- 2.8.1 Data Collection Window
- Appendix A. Bill Of Materials
- Appendix B. Schematics
- Appendix C. Layer Plots
CDB5480U
30 DS893DB5
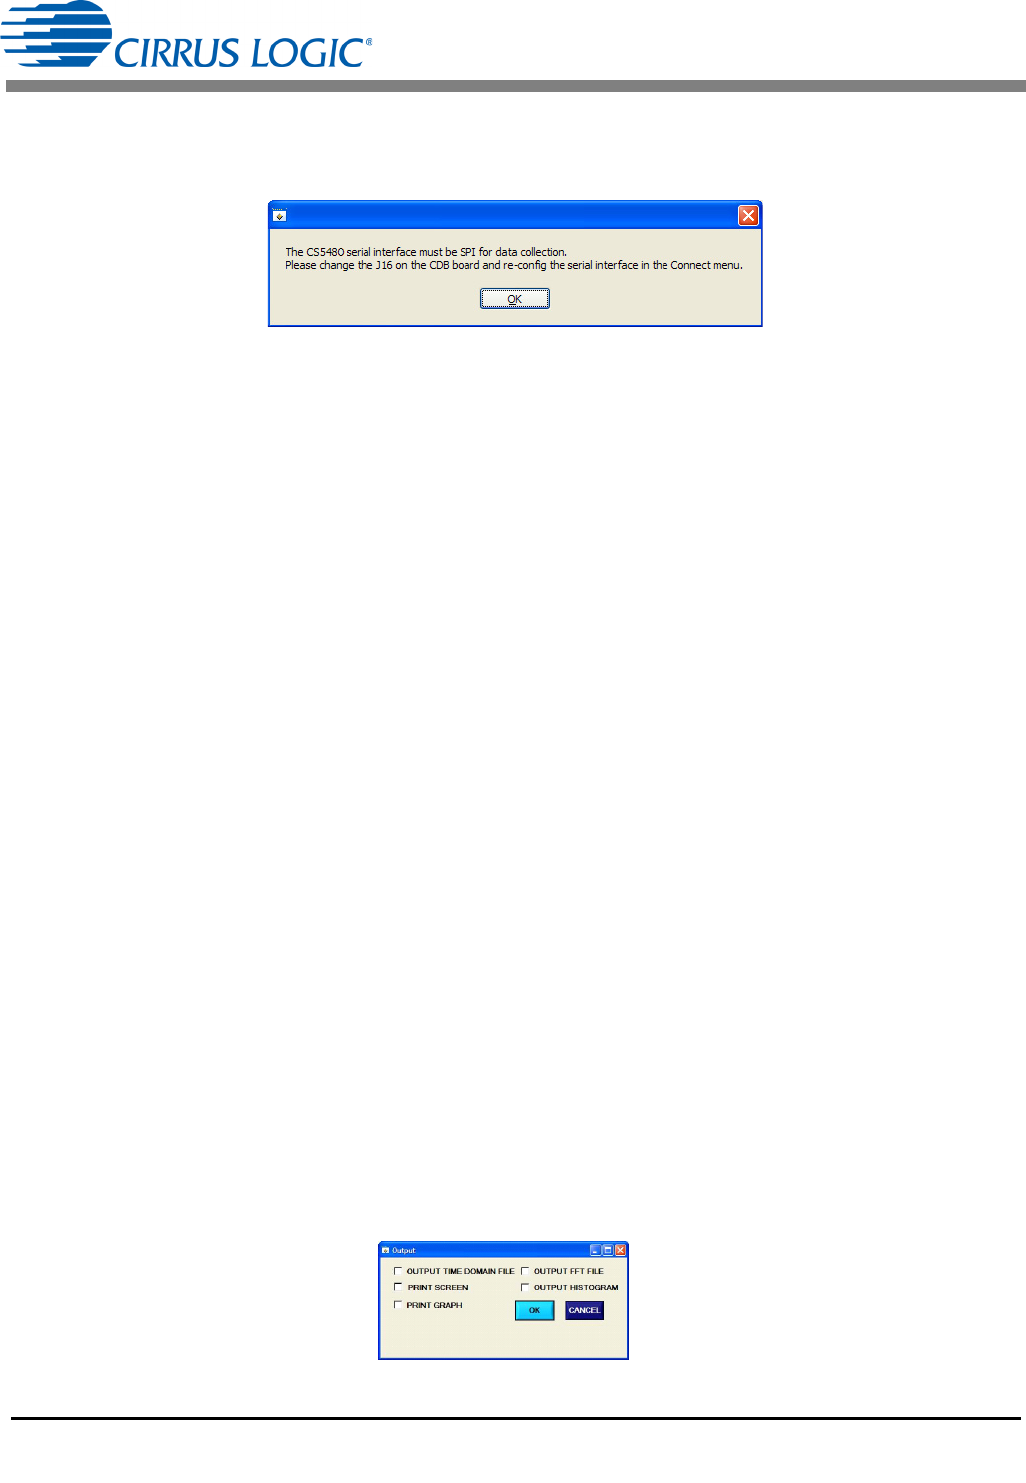
The Data Collection window can only be accessed when operating in SPI mode. When UART serial
communication is enabled, an error window will be displayed. See Figure 24. To enable SPI refer to
“Serial Port Selection” on page 8.
Figure 24. Data Collection UART Error Message
2.8.1.1 Time Domain / FFT/ Histogram Selector
The Time Domain/FFT/Histogram selector selects the type of data processing to perform on the collected
data and displays the results in the plot area. Refer to “Analyzing Data” on page 32 for more information.
2.8.1.2 Config Button
The Config button will bring up the Configuration window, in which the user can modify the data collection
specifications. Refer to “Configuration Window” on page 31 for more information.
2.8.1.3 Collect Button
The Collect button will collect data from the part, to be analyzed in the plot area. See “Collecting Data
Sets” on page 32 for more information.
2.8.1.4 Output Button
The Output button will bring up a window in which the user can output the data to a file for later use, print
out a plot, or print out the entire screen. When saving data, only the data channel being displayed on the
plot will be saved to a file.
2.8.1.5 Zoom Button
The Zoom button allows the user to zoom in on the plot by selecting two points in the plot area. Press the
Restore button to return to the normal data plot, or press the Zoom button again to zoom in even further.
2.8.1.6 Channel Select Button
After data collection, the two buttons labeled as “No Data" will be replaced with Current and Voltage
buttons, allowing the user to choose the appropriate channel for display. In the time domain mode, an
additional Overlay button will be present which allows the user to display all the channels on the same plot.
2.8.1.7 Output Button & Window
The Output button allows the user to:
1. Output Time Domain File
2. Output FFT File
3. Output Histogram
4. Print Screen
5. Print Graph
Figure 25. Data Collection Output Window