
User guide


CDB5463U
22 DS805DB2
analysis processes acquired conversions to produce a histogram plot. Statistical noise calculations are
also calculated and displayed.
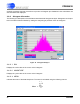
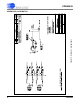
2.8.11 Histogram Information
The following is a description of the indicators associated with histogram analysis. Histograms can be plot-
ted in the Data Collection Window by setting the analysis type pull-down menu to Histogram.
Figure 14. Histogram Analysis
2.8.11.1 BIN
Displays the x-axis value of the cursor on the histogram.
2.8.11.2 MAGNITUDE
Displays the y-axis value of the cursor on the histogram.
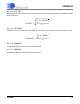
2.8.11.3 MEAN
Indicates the mean of the data sample set. The mean is calculated using the following formula:
Mean
Xi
i0=
n1–
∑
n
----------------=