How-To Guide Chapter 5

Chapter 5. Operation FibeAir 1500 Installation & Operation Manual
5-22 Windows and Menus Revision 2.0
The Received Signal Level graphs show the received signal level over the
past hour.
2. Click on Cancel.
The RSL Monitoring window is closed and you are returned to the Work
Area window.
RSL Statistic Monitoring
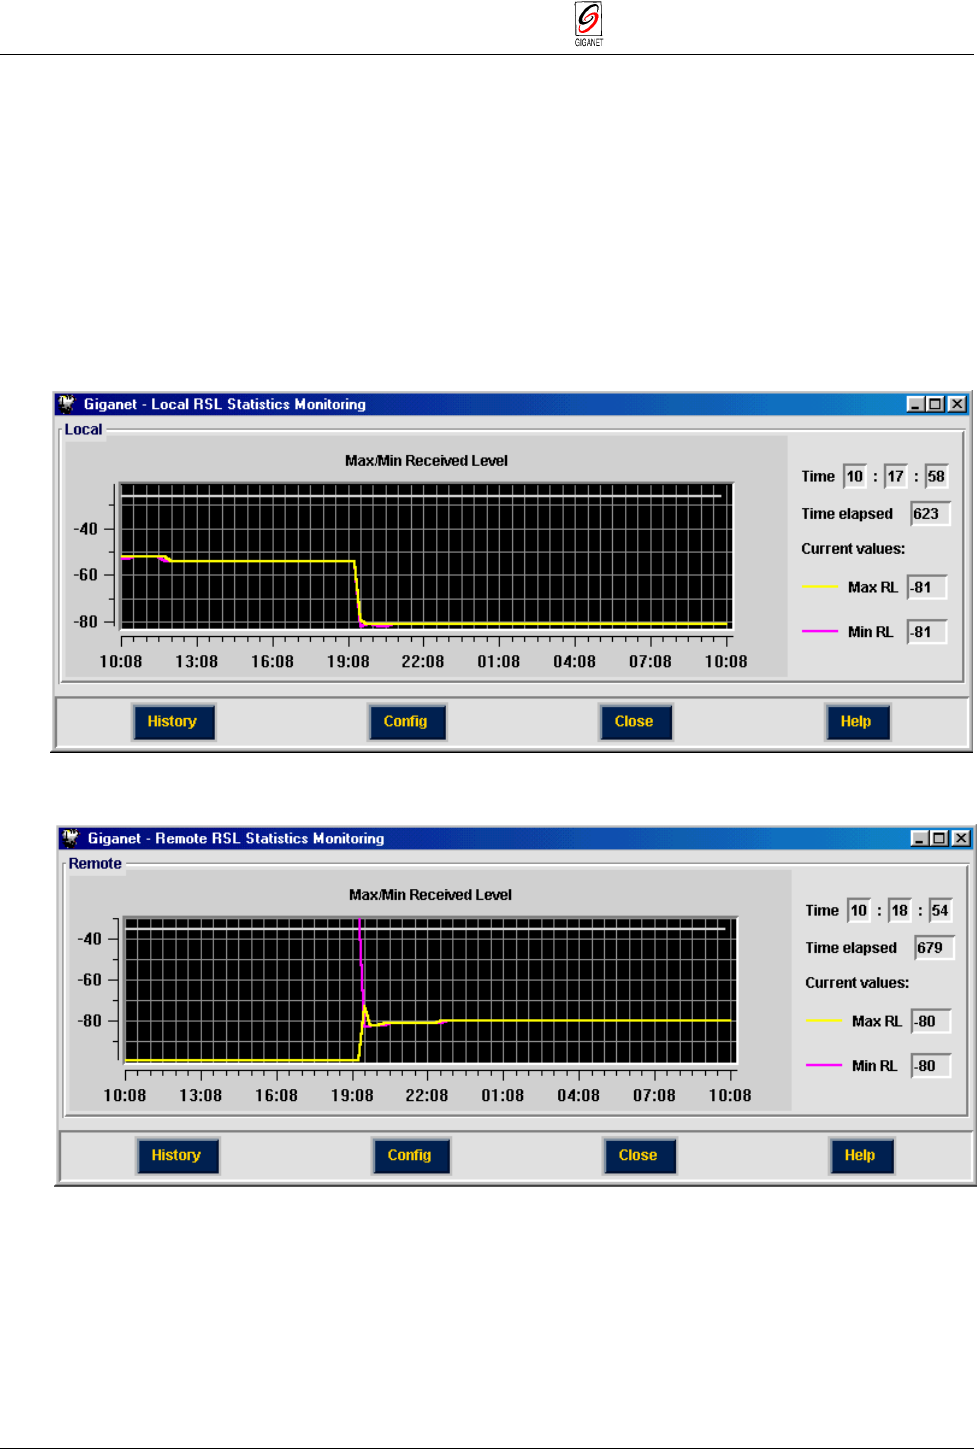
The RSL Statistic Monitoring window displays the RSL values measure over
the past 24 hours.
1. Select Statistics ½ RSL Statistic Monitoring in the Work Area window.
The RSL Statistic Monitoring window is displayed.
Figure 5-25 RSL Statistic Monitoring Window
Figure 5-26 Remote RSL Statistic Monitoring Window
Note
: If there is no communication between the local and remote units, the Remote RSL
Statistics window will not be available.


