CYCLOCOMPUTER Download Software [e-Train Data. Ver.3] for Windows 98/ME/2000/XP http://www.cateye.co.jp/ 0365510 (ENG-PeTD) 3 INTRODUCTION In the case of the e-Train DataTM Ver.3, measured data (memory data, heart rate target zone data, lap data and cadence zone data) stored in the CC-TR100 main unit via the power unit as well as the power related data stored in the power unit are downloaded to the PC. At the same time, those data are all displayed graphically to facilitate checks.
READING THIS MANUAL For quick reference, refer to the sections below, or begin at the start of the manual. Basic installation and operation See page 12-18. Go here to check how to connect the PC, CC-TR100 and power unit, and for information on how to download the measured data. Complete description of e-Train software functions See page 19-25. Go here for descriptions and meanings of buttons, icons and items on the screens of e-Train DataTM Ver. 3.
TABLE OF CONTENTS Download kit INTRODUCTION ............................................. 1 READING THIS MANUAL ............................... 2 LIST OF e-Train Data Ver.3 FUNCTIONS ......... 4 BEFORE USING e-Train Data Ver.3 ................. 5 System requirements for e-Train Data Ver.3 .. 5 INSTALLING e-Train Data Ver. 3 .................... 6 UNINSTALLING e-Train Data Ver. 3 ................ 10 CONNECTING TO PC ..................................... 12 SETTING SERIAL PORT ...............................
LIST OF e-Train Data Ver.3 FUNCTIONS Loading the measured data Downloads stored data in CC-TR100 and Power unit to the PC for data log and analysis. NOTE Measured data other than the power-related data can be downloaded using the download kit. Main screen The stored data is displayed in graph format: The lower window, or full data window, displays all of the data. The upper window, data zoom window, displays only the section of data displayed by the graph cursor in the lower window.
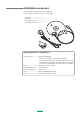
BEFORE USING e-Train Data Ver.3 The following parts are required for using e-Train Data Ver.3. Please be ready for these parts from the power unit package. A. CD-ROM -------------------------------------- 1 B. Power unit ----------------------------------- 1 C. RS232C cable (Serial) ---------------------- 1 D. Serial-USB converter cable ---------------- 1 A D C B System requirements for e-Train Data Ver.
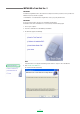
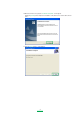
INSTALLING e-Train Data Ver. 3 IMPORTANT! Installation using Windows XP is described in the example: follow this procedure even if your OS is not Windows XP, unless otherwise specified. e-Train Data Ver. 3 is installed under “Program files” unless you specify another folder. IMPORTANT! If you have been using the old version of e-Train Data, uninstall it first. If installation of the new e-Train Data Ver. 3 is unsuccessful, uninstall it and try again. 1. Turn on your computer. 2. Insert the e-Train Data Ver.
5. Click the [Next] button. The “Select installation Folder” screen appears. To change the folder, click the [Browse] button. Specify the desired folder, and click the [OK] button. NOTE If the specified folder does not exist, a new folder is automatically created. To check the amount of available space on the disk, click the [Disc Cost...] button. Click the [OK] button to close the window.
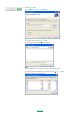
6. Click the [Next] button. The Confirm Installation screen appears. NOTE To change the setting, press the [Back] button for returning to the previous step, and change the setting. 7. Click the [Next] button. Installation begins. 8. After the files being copied, the installation of the driver for the Serial-USB converter cable starts. NOTE For Windows 98, click the [Cancel] button to exit the installation. For Windows 98SE or later, click the [Next>] button to continue the installation. 9.
10.When all of the files are copied, the “Installation Completed” screen appears. Clicking the [Finish] button completes the installation of the driver for the serial-to-USB converter cable. 11.Click the [Close] button to end installation.
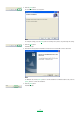
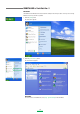
UNINSTALLING e-Train Data Ver. 3 IMPORTANT! Uninstallation from Windows XP is described in the example. Follow the procedure even if you are not using Windows XP, unless otherwise specified. 1. Click the [Start] button. The Start menu appears. 2. Click the [Control Panel] button. The Control Panel appears. IMPORTANT! In some versions of the Windows, select [Set] - [Control Panel] in the Start Menu.
3. Click the [Change or Remove Programs] button. The “Add or Remove Programs” screen appears. IMPORTANT! In some versions of Windows, click [Add or Remove Applications]. 4. Select “e-Train Data Ver. 3,” and click the [Remove] button. IMPORTANT! In some versions of Windows, click the [Add/Remove] button. 5. Click the [Yes] button in the “Add or Remove Programs” window. Uninstallation begins. 6. When the e-Train Data Ver.3 has been deleted, uninstallation is complete.
CONNECTING TO PC Attach the CC-TR100 to the power unit before connecting to the PC. Insert it securely until it clicks home. IMPORTANT! If the CC-TR100 and power unit are not connected securely at all contact points, download may be unsuccessful. CC-TR100 Power unit 9-pin serial cable Connect ing Mto serial port 1. Connect the RS232C cable connector to the RS232C terminal (serial port) of the PC. IMPORTANT! • Connect the cables securely.
SETTING SERIAL PORT Select the serial port to be used 1. Right-click the [Connection Manager] icon on the task tray. A pop-up menu appears. 2. Click “Setup” on the pop-up menu. The Serial Port Setup dialog appears. NOTE Alternatively, double-click the icon to display the dialog. 3. Select the using serial port number from “Serial Port”, and click the [OK] button. When the port number is uncertain: When the port number is uncertain, click the [Auto Recognition] button.
TO SUSPEND WATCHING CONNECTION 1. Right-click the [Connection Manager] icon on the task tray. A pop-up menu appears. 2. Confirm the check on “Watch Connection on the pop-up menu.” When checked, Connection Manager is using the serial port to watch the download connection. When unchecked, Connection Manager releases the serial port to suspend watching the connection. 3. When checked, click “Watch Connection on the pop-up menu.
DOWNLOADING DATA 1. Check that the CC-TR100 is attached and that the power unit has been connected to the PC securely. Then launch Windows. (See page 12.) MENU button 2. Press the [MENU] button of CC-TR100. 3. Press the [MODE-2] button of CC-TR100 until the “PC Link” screen appears on CC-TR100. LAP STAR T/STOP/ENTER PC Link Icon LAP STAR T/STOP/ENTER MODE-2 button 4. Press the [START/STOP/ENTER] button of CC-TR100.
6. Clicking the [Download] button will open a list of data stored in the CC-TR100. 7. A list of files stored in the CC-TR100 appears. 8. Select the file that you wish to download. NOTE You can delete unnecessary data from CC-TR100. Select a file, and click the [Delete] button. When “Delete data in CC-TR100 after download” is checkmarked, the data in CC-TR100 is deleted after the download is completed. 9. Click the [Download] button to begin download process.
10.Data is displayed on e-Train Data Ver. 3. 11.End the download process.
CHANGING THE CC-TR100 SETTINGS VIA THE PC Connect the Download Unit to your PC, and turn it on. 1. First follow the instructions 1-5 for 'Downloading Data' on page 15. 2. After connecting the TR100 to your PC, click the “Set up” button to display the settings stored in the PC.
OPERATING e-Train Data Ver. 3 Starting e-Train Data Ver. 3 1. Open the start menu from the windows task bar. Select [All Programs] - [CATEYE] - [e-Train Data Ver.3] - [DataView]. The Data List window will appear. NOTE If no CC-TR100 data has been downloaded, the Data List window will not appear. 2. Select data that you wish to open from the data list, and click the [Open] button. The selected data appears on the “e-Train Data Ver. 3 (Data Viewer)” screen (see page 26).
Navigating the e-Train Data Ver.3 Data View screen The e-Train Data Ver.3 Data View screen consists of two main parts: the data zoom (upper) window, showing segments of your training data, and the full data (lower) window, showing the downloaded data in full. This section displays the graph lines of heart rate, speed, cadence, and power data (if Power Unit is installed).
Toolbar Print Data List Zoom Out Zoom In Lap Data Change Axis CDC Zone HR Zone Property Power Zone Analysis Statistics Setup The following commands are available in the toolbar: Data List ------------ Displays a list of downloaded data. You can open, delete, import and export data from the list. You can also enter a training schedule in the calendar. Print ---------------- Opens the print window to print the displayed data.
Operating the “e-Train Data Ver.3 Data View” screen Detailed display Clicking the mouse cursor at any point on the data zoom window will display values for that point. Detailed display window Press [Copy to Clipboard] to copy the data in the pop-up window. Press [Close] to close the pop-up window. Scrolling data in upper and lower windows. Move the graph cursor in the lower (full data) display will also move the data in the upper (partial data) display.
Zooming in and out of the graphs 1. Move the graph cursor to the section in the full data window that you wish to zoom in. Graph cursor 2. Click the [Zoom In] icon on the toolbar. The zoomed in data will still correspond with the cursor window in the full data display. NOTE You can also zoom in the graphs from [Graph] - [Zoom in] on the menu bar. Zoom In NOTE Zoom in and out can also be done by changing the size of the graph cursor.
Changing horizontal axis You can change the horizontal axis from time to distance by pressing the [Change Axis] icon. 1. Click the [Change Axis] icon on the toolbar to alternate the horizontal axis between Time and Distance. NOTE You can also switch the horizontal axis from [Graph (G)] - [Change Axis] on the menu bar.
Displaying gridlines in Data Zoom Window Clicking on either side of the vertical axis will display the graph range. Clicking on the left will display gridlines of heart rate and speed, while clicking on the left will display gridlines of cadence and power. Clicking on them a second time will make them disappear.
MANAGING DATA Click on the [Data List] icon on the toolbar to display the Data List window. NOTE Open the Data List window from [File] - [Data List...] on the menu bar. Data List Open Data List Import Delete Calendar Export User List Close The list shows the date, name, time, distance and average speed. Data is sorted in chronological order. When the date, name, time, distance or average speed is clicked, data is sorted in the order of the selected item.
2. Click the [Open] button. The data is displayed on the “e-Train Data Ver. 3 (Data Viewer)” screen in graph format. Deleting data Click the [Open] button. IMPORTANT! Deleted data cannot be recovered. Double-check that the correct data is selected before deleting it. 1. Select data that you wish to delete from the list. 2. Click the [Delete] button. A confirmation window appears. 3. Click the [OK] button. The selected data is deleted from the list.
Importing data You can convert .csv and .etd files to a format usable in e-Train Data Ver. 3. IMPORTANT! Imported data that had been modified by Excel may not be displayed normally. Import the files that were exported from e-Train Data Ver. 3 only. 1. Click the [Import] button. The file selection window appears. NOTE You can also open the file selection window from [File] - [Import...] on the menu bar. 2. Select a file that you wish to import, and click the [Open] button.
MAKING A TRAINING PLAN Press the [Calendar] button to open the Calendar window. Here you can create and manage your training schedules. Save Exercise Plan Add Exercise Plan Load Exercise Plan Data List Calendar User Calendar Close A training schedule is displayed in a calendar format. The following icons are displayed in the Calendar window: Training icon -------- Displayed when there is a training schedule for that day. Click on the icon to see the exercise names and view schedule details.
2. Click the [Add Exercise Plan] button. The Add Plan window appears. 3. Enter the date to which you wish to add a training plan. NOTE Select the date from the calendar that appears by clicking the [Date] pull-down menu. The month can be changed with the arrow buttons at right and left. 4. Enter the training session duration.
5. Enter the training session description. 6. Click the [OK] button. The training plan is added to the calendar. Loading a plan You can load the data in the plan format to add it to the calendar. 1. Click the [Load Exercise Plan] button. The file selection window appears. 2. Select a file that you wish to load, and click the [Open] button. The training plan is loaded into the calendar.
Saving a training plan 1. Click the [User] pull-down list, and select the user whose training schedule you wish to save. 2. Click the [Save Exercise Plan] button. The file selection window to be saved appears. 3. When a list of the current training schedules appears, check the schedules to be saved. Adjust the dates in the “List up Plan data from” box to locate older or newer data. 4. Click the [Save] button. The file selection window appears. 5. Enter a file name, and click the [Save] button.
PRINTING DATA You can print the displayed graphs by clicking the [Print] button. 1. Click the [Print] icon on the toolbar. The Print window appears. Print 2. Make sure that the settings are correct, and click the [OK] button. The displayed data is printed out. NOTE The values and graphs are printed as displayed.
DISPLAYING LAP DATA When viewing training files with lap data, click the [Lap data] button to display lap points. 1. Click the [Lap data] icon on the toolbar. Lap data appears on the graphs. The lap points are connected by lines that represent the average lap values. Lap data NOTE • You can also window lap data from [View] - [Lap Data] on the menu bar. • Click on the lap times or lap numbers to display gridlines. Lap numbers and lap times Lap data 2.
DISPLAYING HEART RATE ZONES 1. Click the [HR Zone] icon on the toolbar. The heart rate zone (HR zone 1) appears in the Data Zoom Window. NOTE You can also display the heart rate zone from [View] - [Heart Rate Zone] on the menu bar. HR Zone HR zone 1 2. Each additional click on the [HR Zone] icon on the toolbar advances through the zones in order from HR zone 1 though 4 to the extra zones EX1 through EX6. HR zone EX 1 Heart rate (HR) zone The HR zone can display a maximum of 10 zones.
DISPLAYING CADENCE ZONE 1. Click the [CDC Zone] icon on the toolbar. The cadence zone (CDC zone) appears in the Data Zoom Window. NOTE You can also display the cadence zone from [View] - [Cadence Zone] on the menu bar. CDC Zone CDC zone 1 2. Each additional click on the [CDC Zone] icon on the toolbar advances through the zones in order from CDC zone to the extra zones EX1 through EX4. CDC zone EX 1 Cadence (CDC) zone The CDC zone can display a maximum of 5 zones.
DISPLAYING POWER ZONES 1. Click the [Power Zone] icon on the toolbar. The power zone (Power zone EX1) appears in the Data Zoom Window. NOTE You can also display the power zone from [View] - [Power Zone] on the menu bar. Power Zone Power zone EX 1 2. Each additional click on the [Power Zone] icon on the toolbar advances through the zones in order from extra zone EX1 through EX10 as the power zone. Power zone The power zone can display a maximum of 10 zones.
DISPLAYING DATA SUMMARY Displaying data overview Click the [Summary] icon on the toolbar to open the Summary window. This displays a summary of the data that is currently displayed in the main Data View window. Summary NOTE You can also open the Summary window from [Window] - [Summary] on the menu bar. Partial Data Full Data Note Close The following functions are available in the Summary window: Full Data ------------ Displays information for the entire training data.
DISPLAYING DATA HISTORY Data saved in e-Train Data Ver.3 can be displayed in bar graph format, showing your training progress. Displaying training history Click on the [History] icon on the toolbar to open the History window. This displays bar graphs representing data by day, week, month, and year. NOTE You can also open the History window from [Window] - [History] on the menu bar.
2. All data show is previous to the date in the box. Adjust the date to view previous data. All data is shown in graph format. NOTE Select the date from the calendar that appears by clicking the [Date] pull-down menu. The month can be changed with the arrow buttons at right and left. 3. Click the [Time increment] pull-down menu, and select [Daily], [Weekly], [Monthly] or [Yearly].
4. Click the [Display option] buttons to display the corresponding data in bar graph format. A maximum of three items of data can be displayed. The graphs are color coordinated with the buttons on the right. Click on each button to view the corresponding values.
Displaying graph of time in zone Click the [Zone] button in the statistic window to open the Zone window. Time in zone is displayed in the graph below. Time Increment Date Zone select Zone History User Close The following functions are available in the Zone window: Date ------------------------ All data show in graphs is previous to this date. Zone select ---------------- Allows you to select the zone data you wish to view.
2. Select the date from which you wish to view training data. The time in zone data will be be displayed in the graph below. NOTE Select the date from the calendar that appears by clicking the [Date] pull-down menu. The month can be changed with the arrow buttons at right and left. 3. Click the [Time Increment] pull-down menu, and select [Daily], [Weekly], [Monthly] or [Yearly].
4. Click the [Zone select] pull-down menu, and select the zone that you wish to display. NOTE If zones are added in the user setup menu, the registered zones are displayed in the pull-down list (see page 47).
DATA ANALYSIS Click on the [Analysis] icon on the toolbar to open the Analysis window. NOTE You can open the Analysis window from [Window] - [Analysis] on the menu bar. Analysis In the Analysis window, you can display data for each target zone in bar graph format, and compare it to the initial target zone. Graph Close Clicking on an individual bar from the graph will display data for that bar. NOTE The graphs for EX are displayed only when EX zones are added in the user setup menu (see page 47).
CHANGING SETTINGS Click the [Setup] icon of the toolbar to open the Setup window. The setup window allows you to change settings for both e-Train Data Ver.3 and the CC-TR100. Setup NOTE You can open the Setup window from [Edit] - [Config...] on the menu bar. Changing e-Train Data Ver. 3 settings Change the graph settings for the main e-Train Data screen in this window. Graph User Graph Lines .
Changing user settings Click the [User] button in the Setup window to open the user setting change window. Here you can register user information or change settings for extra zones. IMPORTANT! The zone settings in this window only apply to the extra zones of e-Train Data Ver.3. They are independent of the zone settings of CC-TR100.
ON-LINE MEASUREMENT On-Line measurement displays live torque values and records training data while training indoors, with a direct connection between the optional Power Unit and the PC. IMPORTANT! The online measurement can be performed only when the optional Power Unit has been installed on the bicycle. Online measurement procedure Connect the power unit and the PC. Start the online measurement when e-Train Data Ver. 3 is not activated. 1. Install CC-TR100 in the power unit. 2.
6. To stop, press the [START/STOP/ENTER] button of CC-TR100. The “On Line [e-Train Data Ver. 3]” screen closes, and the data is transmitted to the PC. IMPORTANT! It may take a few minutes to complete the data transmission. Wait until it is completed to make sure all the data has been transmitted. LAP STAR T/STOP/ENTER 7. The resulting data displayed in the main Data View screen of e-Train Data Ver. 3.
Pedal Position Dependent Graph The Pedal position dependent graph displays an easy-to-read graph of torque distribution throughout each pedal stroke. Details CDC sensor position Torque level Reverse Torque transition graph Time Base Pedal Stroke The following functions are available in the Pedal window: Details -------------------- Displays the exercise duration, current cadence, average cadence, current power and average power of the data that is currently measured.
QUICK REFERENCE Icon Toolbar Button Description Displays a list of downloaded data. You can display, delete, import and export data. Data List Data List Displays training plans and downloaded data in a calendar format. Print Calendar Prints data. Zoom In Zooms in the graph in data zoom window (upper graph) Zoom Out Zooms out the graph in data zoom window (upper graph) Change Axis Switches the horizontal axis between time and distance. Lap Data Displays or hides lap data.
TROUBLESHOOTING If a malfunction occurs, check the following before contacting CatEye or your retailer for repair or service You cannot install e-Train Data Ver. 3 in your PC. Does your PC meet the system requirements to run e-Train Data Ver. 3? In order to use e-Train Data Ver. 3, the hardware and software requirements described on page 5 must be met. You cannot download data from CC-TR100. Is the Power Unit connected to your PC properly? See page 12, and check the connection again.
COPYRIGHT This Software is owned by CatEye Co., Ltd., and its structure, organization and code are all property of CatEye. The Software is protected by Japanese and United States Copyright Laws and International Treaty provision. According to international copyright laws, this software may not be modified, adapted, translated, copied, decompiled, or otherwise altered, without the consent of CatEye. CatEye Co., Ltd. does not grant any intellectual property rights in the Software.