
User guide
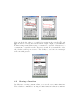
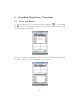
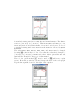

Note that your image may not match exactly. We will discuss how to make
the graphs match exactly in the latter part of this section. For our calculator,
the the grid shows values -7, 3, 7, -3 (listed clockwise) which represent the
minimum and maximum values of each axes. In our example, the maximum
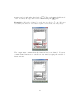
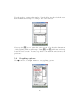
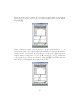
tick mark along the x-axis is 7. If we tap the r icon, the values change
accordingly. The values have now changed to -7, 8,7 and -8 respectively. The
values can be described as the following:
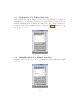
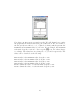
Xmin stands for the minimum value along the x-axis.
Xmax stands for the maximum value along the x-axis.
Ymin stands for the minimum value along the y-axis.
Ymax stands for the maximum value along the y-axis.
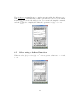
Xscale defines the value of each tick mark along the x-axis.
Yscale defines the value of each tick mark along the y-axis.
28