
User's Manual
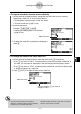
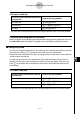
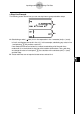
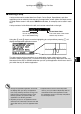
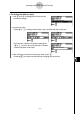
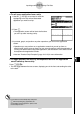
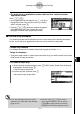
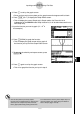
Table Of Contents
- Quick-Start
- Precautions when Using this Product
- Contents
- Getting Acquainted— Read This First!
- Chapter 1 Basic Operation
- Chapter 2 Manual Calculations
- Chapter 3 List Function
- Chapter 4 Equation Calculations
- Chapter 5 Graphing
- 5-1 Sample Graphs
- 5-2 Controlling What Appears on a Graph Screen
- 5-3 Drawing a Graph
- 5-4 Storing a Graph in Picture Memory
- 5-5 Drawing Two Graphs on the Same Screen
- 5-6 Manual Graphing
- 5-7 Using Tables
- 5-8 Dynamic Graphing
- 5-9 Graphing a Recursion Formula
- 5-10 Changing the Appearance of a Graph
- 5-11 Function Analysis
- Chapter 6 Statistical Graphs and Calculations
- Chapter 7 Financial Calculation (TVM)
- Chapter 8 Programming
- Chapter 9 Spreadsheet
- Chapter 10 eActivity
- Chapter 11 System Settings Menu
- Chapter 12 Data Communications
- Appendix
20070201
3. Press w to call up the graph screen.
• Since you have not input any data yet, the graph screen that appears will be blank.
4. Press !6 (G ↔ T) to display the Graph Editor screen.
• This will display the current Graph strip’s Graph relation list. Since this list is
independent of the GRAPH mode Graph relation list, it will be blank because this is a
new Graph strip.
5. Input the function you want to graph (Y1 = X
2
in
this example).
6. Press 6 (DRAW) to graph the function.
• This will display the graph screen with a graph of
the function you input on the Graph Editor screen.
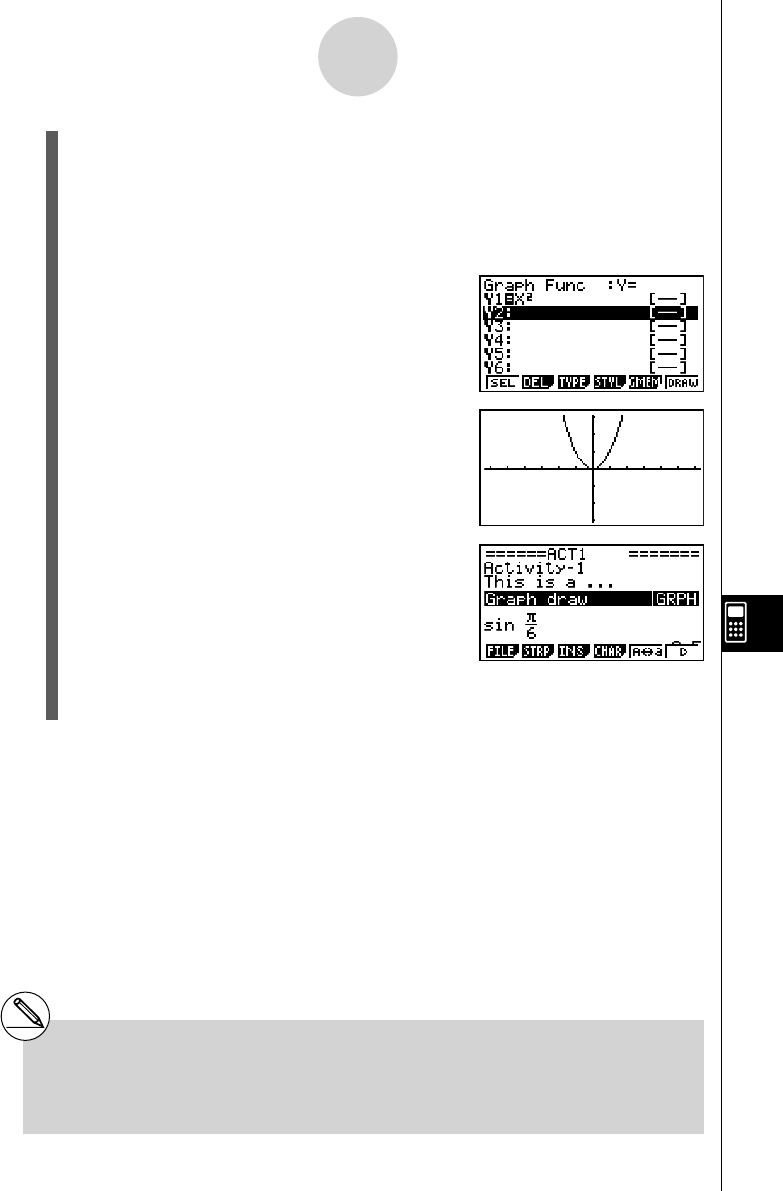
7. To return to the eActivity workspace screen, press
! a ( ' ).
8. Press w again to call up the graph screen.
• This will re-graph the function you input in step 5.
10-3-14
Inputting and Editing eActivity File Data
# You can also paste a previously copied
function from the clipboard into a graph screen
called up from a Graph strip. Note, however,
that a graph produced by pasting the function
is not stored in the memory of the Graph strip. For
more information, see “Using Copy and Paste to
Draw a Graph” (page 10-3-16).