
User's Manual
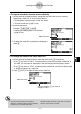
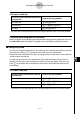
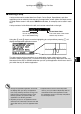
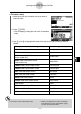
Table Of Contents
- Quick-Start
- Precautions when Using this Product
- Contents
- Getting Acquainted— Read This First!
- Chapter 1 Basic Operation
- Chapter 2 Manual Calculations
- Chapter 3 List Function
- Chapter 4 Equation Calculations
- Chapter 5 Graphing
- 5-1 Sample Graphs
- 5-2 Controlling What Appears on a Graph Screen
- 5-3 Drawing a Graph
- 5-4 Storing a Graph in Picture Memory
- 5-5 Drawing Two Graphs on the Same Screen
- 5-6 Manual Graphing
- 5-7 Using Tables
- 5-8 Dynamic Graphing
- 5-9 Graphing a Recursion Formula
- 5-10 Changing the Appearance of a Graph
- 5-11 Function Analysis
- Chapter 6 Statistical Graphs and Calculations
- Chapter 7 Financial Calculation (TVM)
- Chapter 8 Programming
- Chapter 9 Spreadsheet
- Chapter 10 eActivity
- Chapter 11 System Settings Menu
- Chapter 12 Data Communications
- Appendix
20070201
10-3-7
Inputting and Editing eActivity File Data
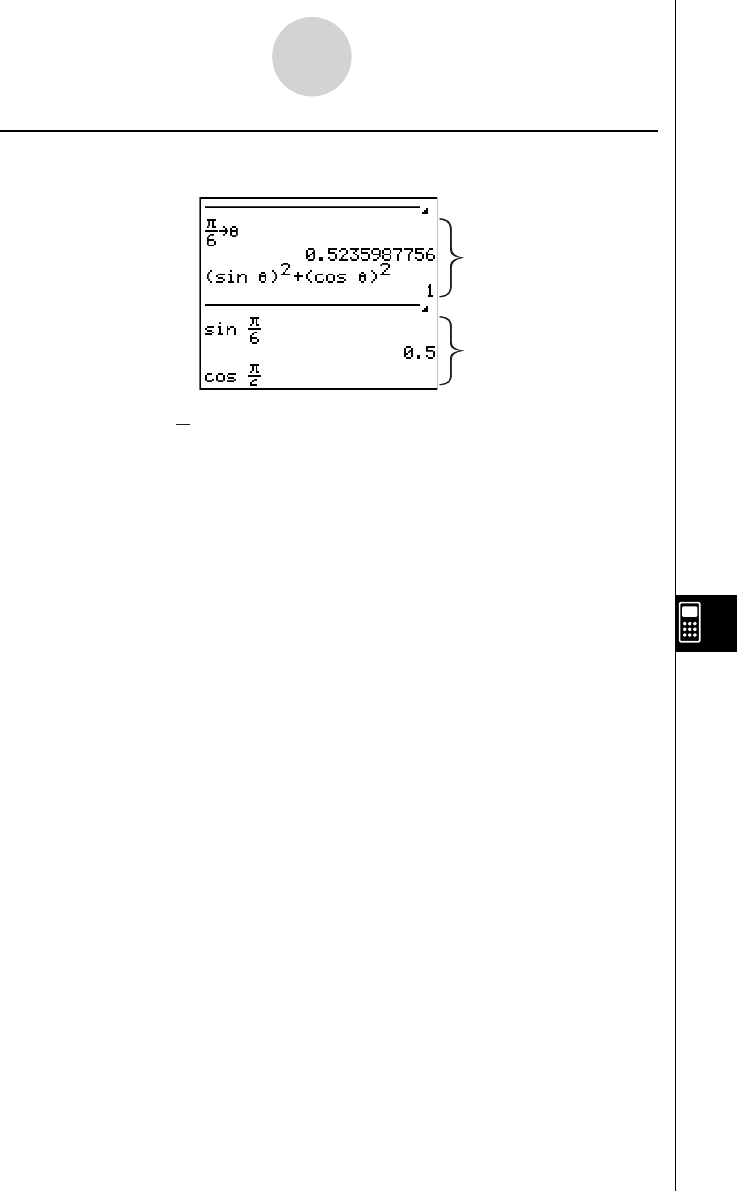
u Stop Line Example
The following screen shows how you can use stop lines to group calculation steps.
A
B
A: Substituting a value (
π
6
here) for
θ
in the expression in line 1 executes (sin
θ
)
2
+ (cos
θ
)
2
in line 3, and displays the result in line 4 (1). In this example, substituting any value in line
1 and pressing w will produce a result of 1.
If we wanted to test various values for
θ
without recalculating all of the math lines
underneath it, we could insert a stop line at the location shown above. Then, each time
we change the value of
θ
and press w , the calculator will re-calculate (sin
θ
)
2
+ (cos
θ
)
2
and then stop.
B: These math lines are not required to test various values for
θ
.