
User's Manual
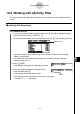
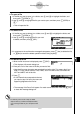
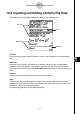
Table Of Contents
- Quick-Start
- Precautions when Using this Product
- Contents
- Getting Acquainted— Read This First!
- Chapter 1 Basic Operation
- Chapter 2 Manual Calculations
- Chapter 3 List Function
- Chapter 4 Equation Calculations
- Chapter 5 Graphing
- 5-1 Sample Graphs
- 5-2 Controlling What Appears on a Graph Screen
- 5-3 Drawing a Graph
- 5-4 Storing a Graph in Picture Memory
- 5-5 Drawing Two Graphs on the Same Screen
- 5-6 Manual Graphing
- 5-7 Using Tables
- 5-8 Dynamic Graphing
- 5-9 Graphing a Recursion Formula
- 5-10 Changing the Appearance of a Graph
- 5-11 Function Analysis
- Chapter 6 Statistical Graphs and Calculations
- Chapter 7 Financial Calculation (TVM)
- Chapter 8 Programming
- Chapter 9 Spreadsheet
- Chapter 10 eActivity
- Chapter 11 System Settings Menu
- Chapter 12 Data Communications
- Appendix
20070201
10-1-7
eActivity Overview
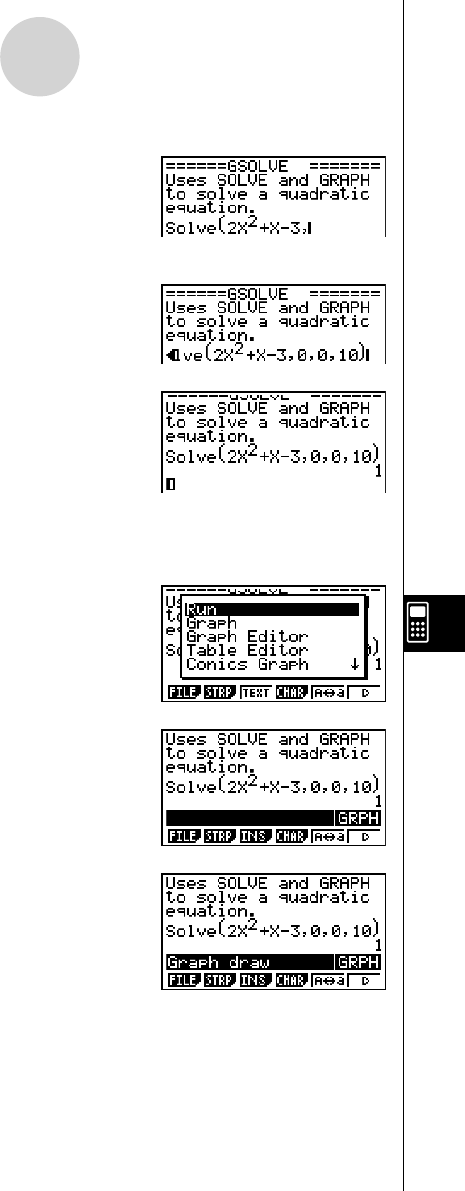
2. Specify the Solve calculation, and then enter the function.
A K 4 (CALC)1 (Solve)
c vx + v -d,
3. Input the initial estimate value, the lower limit, and the upper limit.
a,a,ba)
4. Press w to solve for x .
• This will display the solution ( x = 1) and move the
cursor to the beginning of the next line.
5. Press J twice to close the option (OPTN) menu.
5. Now to draw a graph, insert a Graph strip into the eActivity.
1. Press 2 (STRP).
• This will display a dialog box with a list of
insertable strips.
2. On the list, select “Graph”, and then press w .
• This will insert a Graph strip, ready for you to input
a title.
3. Type a title for the list (“Graph draw” for this
example), and then press w .
• This will register the title and highlight the strip.