
User's Manual
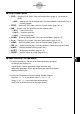
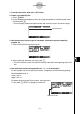
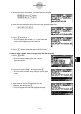
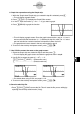
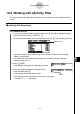
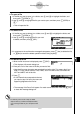
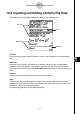
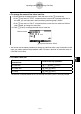
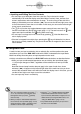
Table Of Contents
- Quick-Start
- Precautions when Using this Product
- Contents
- Getting Acquainted— Read This First!
- Chapter 1 Basic Operation
- Chapter 2 Manual Calculations
- Chapter 3 List Function
- Chapter 4 Equation Calculations
- Chapter 5 Graphing
- 5-1 Sample Graphs
- 5-2 Controlling What Appears on a Graph Screen
- 5-3 Drawing a Graph
- 5-4 Storing a Graph in Picture Memory
- 5-5 Drawing Two Graphs on the Same Screen
- 5-6 Manual Graphing
- 5-7 Using Tables
- 5-8 Dynamic Graphing
- 5-9 Graphing a Recursion Formula
- 5-10 Changing the Appearance of a Graph
- 5-11 Function Analysis
- Chapter 6 Statistical Graphs and Calculations
- Chapter 7 Financial Calculation (TVM)
- Chapter 8 Programming
- Chapter 9 Spreadsheet
- Chapter 10 eActivity
- Chapter 11 System Settings Menu
- Chapter 12 Data Communications
- Appendix

20070201
10-1-6
eActivity Overview
1. From the main menu, enter the e
• ACT mode.
2. Create a new eActivity fi le.
1. Press 2 (NEW).
2. On the dialog box that appears, enter up to eight characters for the eActivity fi le name,
and then press w .
• This will display a blank workspace screen with a text line cursor (for text line input).
Text line cursor
3. Use the text line to input to type in comments, information about the eActivity
problem, etc.
1. Here we will input the text shown below.
2. After inputting all of the text you want, press w .
• This will cause the cursor to move from the end of the text to the beginning of the next
line.
4. Use math lines to enter the expression (2 x
2
+ x – 3 = 0) and solve it.
For this example, we will use the Solve function, confi guring it with the following settings.
Initial Estimated Value: 0
Lower Limit: 0
Upper Limit: 10
For details about using the Solve function, see page 8-6-9.
1. First, press 3 (TEXT) to change to a math line.
Math line cursor