
User's Manual
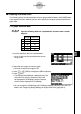
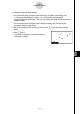
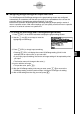
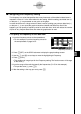
Table Of Contents
- Quick-Start
- Precautions when Using this Product
- Contents
- Getting Acquainted— Read This First!
- Chapter 1 Basic Operation
- Chapter 2 Manual Calculations
- Chapter 3 List Function
- Chapter 4 Equation Calculations
- Chapter 5 Graphing
- 5-1 Sample Graphs
- 5-2 Controlling What Appears on a Graph Screen
- 5-3 Drawing a Graph
- 5-4 Storing a Graph in Picture Memory
- 5-5 Drawing Two Graphs on the Same Screen
- 5-6 Manual Graphing
- 5-7 Using Tables
- 5-8 Dynamic Graphing
- 5-9 Graphing a Recursion Formula
- 5-10 Changing the Appearance of a Graph
- 5-11 Function Analysis
- Chapter 6 Statistical Graphs and Calculations
- Chapter 7 Financial Calculation (TVM)
- Chapter 8 Programming
- Chapter 9 Spreadsheet
- Chapter 10 eActivity
- Chapter 11 System Settings Menu
- Chapter 12 Data Communications
- Appendix
20070201
9-6-4
Statistical Graphs
5. Confi gure the graph setup settings.
• For information about confi guring the Graph Type and Mark Type settings, see
“1. General graph settings” on page 6-1-2, “6-2 Calculating and Graphing
Single-Variable Statistical Data”, and “6-3 Calculating and Graphing Paired-Variable
Statistical Data”.
• For information about confi guring the Frequency setting, see “Confi guring the
Frequency Setting” (page 9-6-6).
6. After all of the settings are the way you want, press J to exit the graph settings
screen.
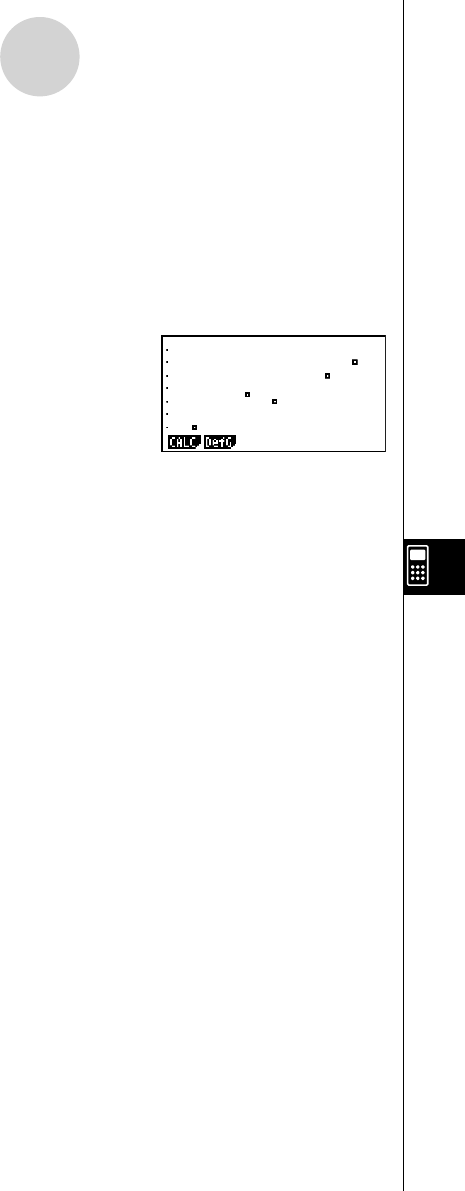
7. Press 1 (GPH1).
• This will draw a graph in accordance with the
StatGraph1 settings.