
User's Manual
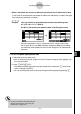
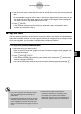
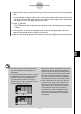

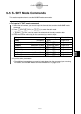
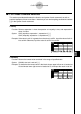
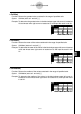
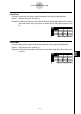
Table Of Contents
- Quick-Start
- Precautions when Using this Product
- Contents
- Getting Acquainted— Read This First!
- Chapter 1 Basic Operation
- Chapter 2 Manual Calculations
- Chapter 3 List Function
- Chapter 4 Equation Calculations
- Chapter 5 Graphing
- 5-1 Sample Graphs
- 5-2 Controlling What Appears on a Graph Screen
- 5-3 Drawing a Graph
- 5-4 Storing a Graph in Picture Memory
- 5-5 Drawing Two Graphs on the Same Screen
- 5-6 Manual Graphing
- 5-7 Using Tables
- 5-8 Dynamic Graphing
- 5-9 Graphing a Recursion Formula
- 5-10 Changing the Appearance of a Graph
- 5-11 Function Analysis
- Chapter 6 Statistical Graphs and Calculations
- Chapter 7 Financial Calculation (TVM)
- Chapter 8 Programming
- Chapter 9 Spreadsheet
- Chapter 10 eActivity
- Chapter 11 System Settings Menu
- Chapter 12 Data Communications
- Appendix
20070201
u CellMax(
Function: Returns the greatest value contained in the range of specifi ed cells.
Syntax: CellMax( start cell : end cell [ ) ]
Example: To determine the greatest value in the block whose upper left corner is located at
A3 and whose lower right corner is located at C5, and input the result in cell A1:
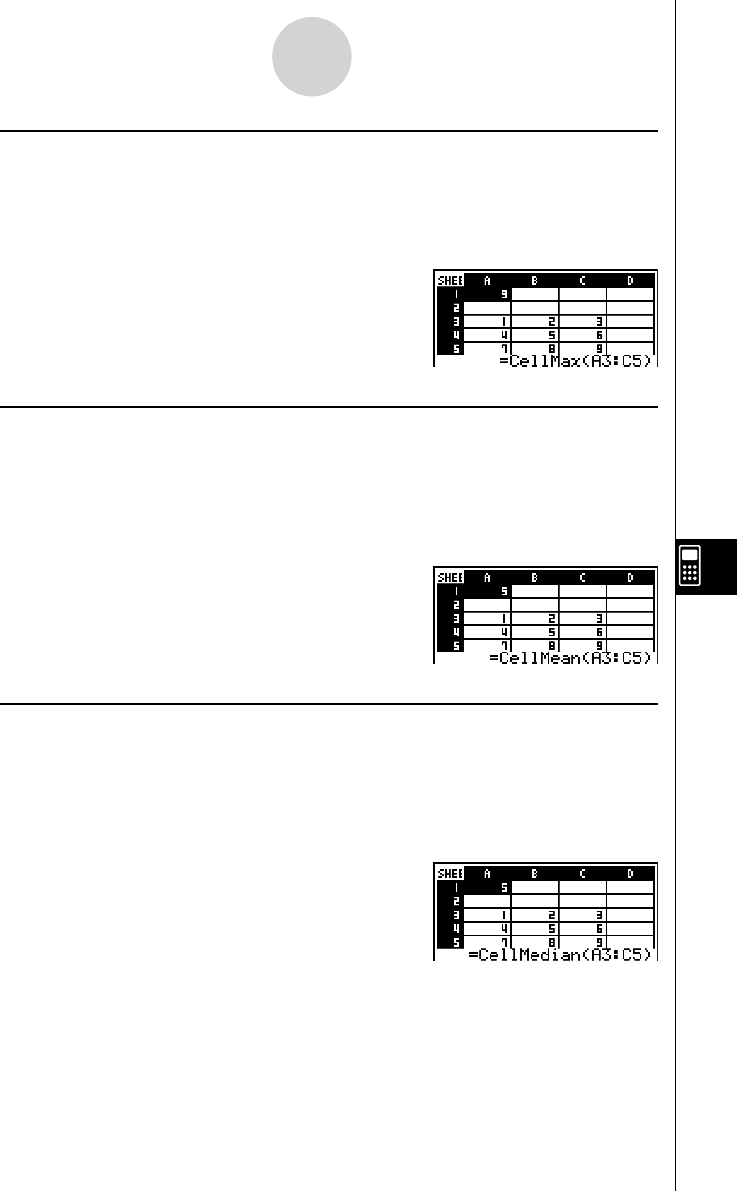
u CellMean(
Function: Returns the mean of the values contained in the range of specifi ed cells.
Syntax: CellMean( start cell : end cell [ ) ]
Example: To determine the mean of the values in the block whose upper left corner is located
at A3 and whose lower right corner is located at C5, and input the result in cell
A1:
u CellMedian(
Function: Returns the median of the values contained in the range of specifi ed cells.
Syntax: CellMedian( start cell : end cell [ ) ]
Example: To determine the median of the values in the block whose upper left corner is
located at A3 and whose lower right corner is located at C5, and input the result
in cell A1:
9-5-3
S
•
SHT Mode Commands