
User's Manual
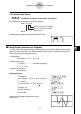
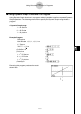
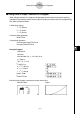
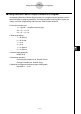
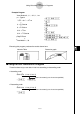
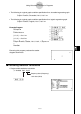
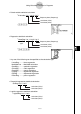
Table Of Contents
- Quick-Start
- Precautions when Using this Product
- Contents
- Getting Acquainted— Read This First!
- Chapter 1 Basic Operation
- Chapter 2 Manual Calculations
- Chapter 3 List Function
- Chapter 4 Equation Calculations
- Chapter 5 Graphing
- 5-1 Sample Graphs
- 5-2 Controlling What Appears on a Graph Screen
- 5-3 Drawing a Graph
- 5-4 Storing a Graph in Picture Memory
- 5-5 Drawing Two Graphs on the Same Screen
- 5-6 Manual Graphing
- 5-7 Using Tables
- 5-8 Dynamic Graphing
- 5-9 Graphing a Recursion Formula
- 5-10 Changing the Appearance of a Graph
- 5-11 Function Analysis
- Chapter 6 Statistical Graphs and Calculations
- Chapter 7 Financial Calculation (TVM)
- Chapter 8 Programming
- Chapter 9 Spreadsheet
- Chapter 10 eActivity
- Chapter 11 System Settings Menu
- Chapter 12 Data Communications
- Appendix

20070201
8-6-11
Using Calculator Functions in Programs
1
!m6631
2
4121J
3
11J
4
24J
5
J4141
6
!J621
Executing this program produces the scatter
diagram shown here.
k Performing Statistical Calculations
• Single-variable statistical calculation
1
1-Variable List1 , List 2
Frequency data (Frequency)
x -axis data (XList)
1
4161
• The following is a typical graph condition specifi cation for a sinusoidal regression graph.
S-Gph1 DrawOn, Sinusoidal, List 1, List 2 _
• The following is a typical graph condition specifi cation for a logistic regression graph.
S-Gph1 DrawOn, Logistic, List 1, List 2 _
Example Program
ClrGraph_
1
S-Wind Auto_
{1, 2, 3} → List 1_
{1, 2, 3} → List 2_
23 4 5
S-Gph1 DrawOn, Scatter, List 1, List 2, 1, Square _
6
DrawStat