
User's Manual
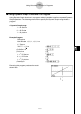
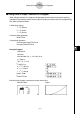
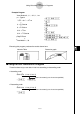
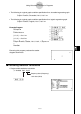
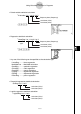
Table Of Contents
- Quick-Start
- Precautions when Using this Product
- Contents
- Getting Acquainted— Read This First!
- Chapter 1 Basic Operation
- Chapter 2 Manual Calculations
- Chapter 3 List Function
- Chapter 4 Equation Calculations
- Chapter 5 Graphing
- 5-1 Sample Graphs
- 5-2 Controlling What Appears on a Graph Screen
- 5-3 Drawing a Graph
- 5-4 Storing a Graph in Picture Memory
- 5-5 Drawing Two Graphs on the Same Screen
- 5-6 Manual Graphing
- 5-7 Using Tables
- 5-8 Dynamic Graphing
- 5-9 Graphing a Recursion Formula
- 5-10 Changing the Appearance of a Graph
- 5-11 Function Analysis
- Chapter 6 Statistical Graphs and Calculations
- Chapter 7 Financial Calculation (TVM)
- Chapter 8 Programming
- Chapter 9 Spreadsheet
- Chapter 10 eActivity
- Chapter 11 System Settings Menu
- Chapter 12 Data Communications
- Appendix
20070201
The graph conditions that are required depends on the graph type. See “Changing Graph
Parameters” (page 6-1-2).
• The following is a typical graph condition specifi cation for a scatter diagram or
xy Line
graph.
S-Gph1 DrawOn, Scatter, List 1, List 2, 1, Square _
In the case of an
xy line graph, replace “Scatter” in the above specifi cation with “ xy Line”.
• The following is a typical graph condition specifi cation for a normal probability plot.
S-Gph1 DrawOn, NPPlot, List 1, Square _
• The following is a typical graph condition specifi cation for a single-variable graph.
S-Gph1 DrawOn, Hist, List 1, List 2 _
The same format can be used for the following types of graphs, by simply replacing “Hist” in
the above specifi cation with the applicable graph type.
Histogram: ..................................... Hist
Median Box: ................................... MedBox*
1
Normal Distribution: ....................... N-Dist
Broken Line: ................................... Broken
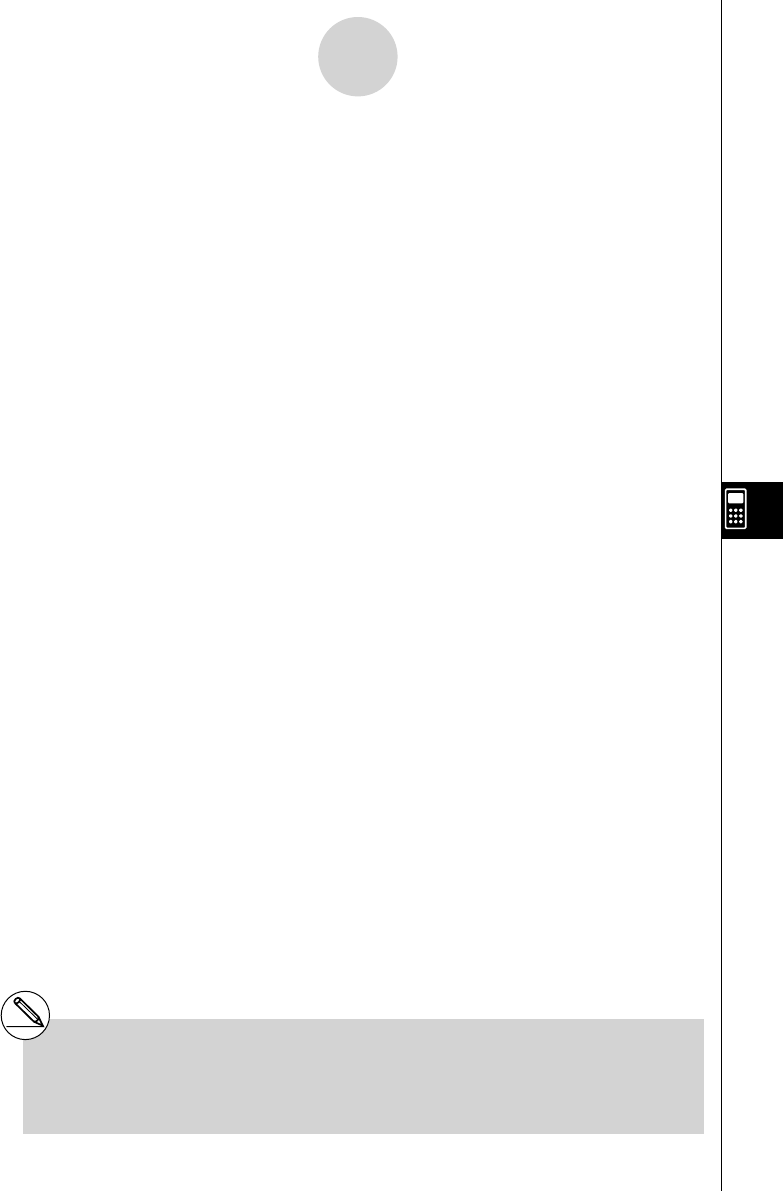
• The following is a typical graph condition specifi cation for a regression graph.
S-Gph1 DrawOn, Linear, List 1, List 2, List 3 _
The same format can be used for the following types of graphs, by simply replacing “Linear”
in the above specifi cation with the applicable graph type.
Linear Regression: ........................ Linear
Med-Med: ...................................... Med-Med
Quadratic Regression: ................... Quad
Cubic Regression: ......................... Cubic
Quartic Regression: ....................... Quart
Logarithmic Regression: ................ Log
Exponential Regression: ................ Exp
Power Regression: ......................... Power
8-6-10
Using Calculator Functions in Programs
*
1
Outliers:On
S-Gph1 DrawOn, MedBox, List 1, 1, 1
Outliers:Off
S-Gph1 DrawOn, MedBox, List 1, 1, 0