
User's Manual
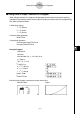
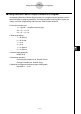
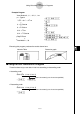
Table Of Contents
- Quick-Start
- Precautions when Using this Product
- Contents
- Getting Acquainted— Read This First!
- Chapter 1 Basic Operation
- Chapter 2 Manual Calculations
- Chapter 3 List Function
- Chapter 4 Equation Calculations
- Chapter 5 Graphing
- 5-1 Sample Graphs
- 5-2 Controlling What Appears on a Graph Screen
- 5-3 Drawing a Graph
- 5-4 Storing a Graph in Picture Memory
- 5-5 Drawing Two Graphs on the Same Screen
- 5-6 Manual Graphing
- 5-7 Using Tables
- 5-8 Dynamic Graphing
- 5-9 Graphing a Recursion Formula
- 5-10 Changing the Appearance of a Graph
- 5-11 Function Analysis
- Chapter 6 Statistical Graphs and Calculations
- Chapter 7 Financial Calculation (TVM)
- Chapter 8 Programming
- Chapter 9 Spreadsheet
- Chapter 10 eActivity
- Chapter 11 System Settings Menu
- Chapter 12 Data Communications
- Appendix
20070201
k Using Table & Graph Functions in a Program
Table & Graph functions in a program can generate numeric tables and perform graphing
operations. The following shows various types of syntax you need to use when programming
with Table & Graph functions.
• Table range setting
1 → F Start_
5 → F End_
1 → F pitch_
• Numeric table generation
DispF-Tbl_
• Graph draw operation
Connect type: DrawFTG-Con_
Plot type: DrawFTG-Plt_
Example Program
ClrGraph_
ClrText_
View Window 0, 6, 1, –20, 106, 10_
Y = Type_
”3X
2
– 2” → Y1_
1
T SelOn 1_
1
4611
0 →
2
F Start_
2
J 611
6 →
3
F End_
3
2
1 →
4
F pitch_
4
3
5
DispF-Tbl^
5
! J 6241
6
DrawFTG-Con
6
! J 6242
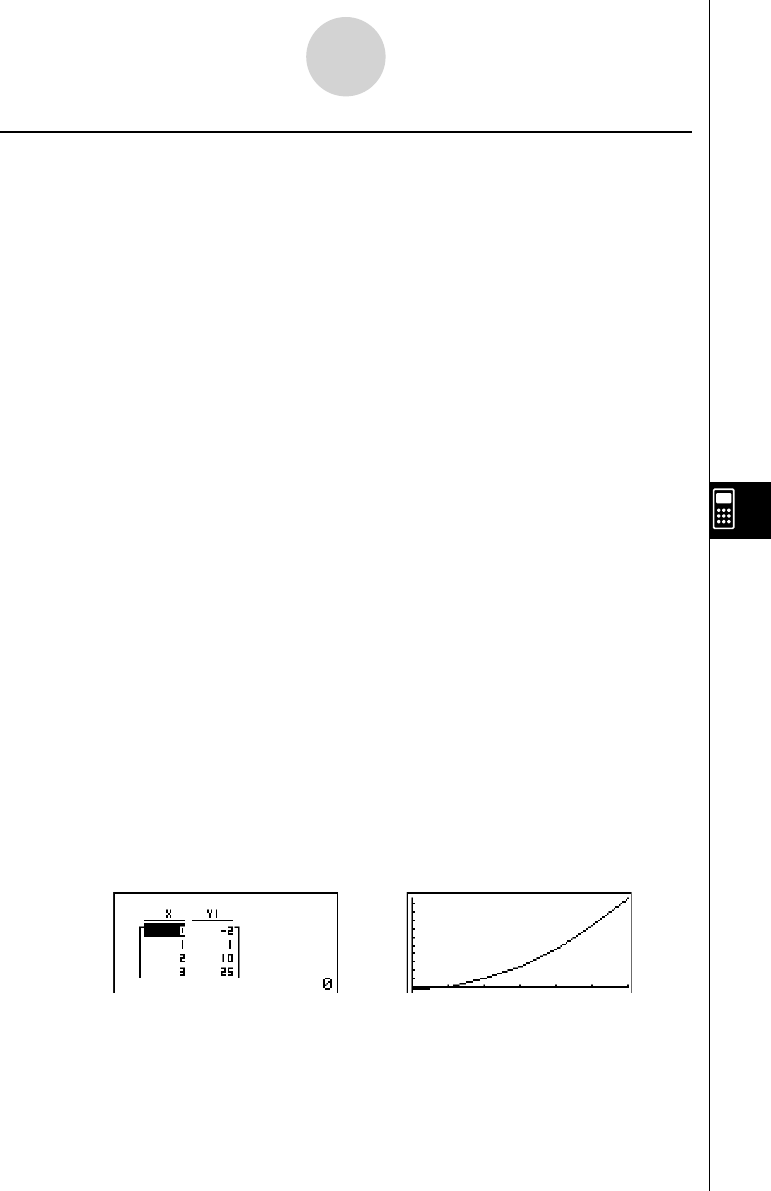
Executing this program produces the results shown here.
Numeric Table Graph
8-6-6
Using Calculator Functions in Programs