
User's Manual
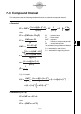
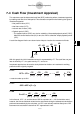
Table Of Contents
- Quick-Start
- Precautions when Using this Product
- Contents
- Getting Acquainted— Read This First!
- Chapter 1 Basic Operation
- Chapter 2 Manual Calculations
- Chapter 3 List Function
- Chapter 4 Equation Calculations
- Chapter 5 Graphing
- 5-1 Sample Graphs
- 5-2 Controlling What Appears on a Graph Screen
- 5-3 Drawing a Graph
- 5-4 Storing a Graph in Picture Memory
- 5-5 Drawing Two Graphs on the Same Screen
- 5-6 Manual Graphing
- 5-7 Using Tables
- 5-8 Dynamic Graphing
- 5-9 Graphing a Recursion Formula
- 5-10 Changing the Appearance of a Graph
- 5-11 Function Analysis
- Chapter 6 Statistical Graphs and Calculations
- Chapter 7 Financial Calculation (TVM)
- Chapter 8 Programming
- Chapter 9 Spreadsheet
- Chapter 10 eActivity
- Chapter 11 System Settings Menu
- Chapter 12 Data Communications
- Appendix
20070201
7-1-2
Before Performing Financial Calculations
k Graphing in the TVM Mode
After performing a fi nancial calculation, you can use 6 (GRPH) to graph the results as
shown below.
• Pressing 1 (Trace) or !1 (TRCE) while a graph is on the display activates Trace,
which can be used to look up other fi nancial values. In the case of simple interest, for
example, pressing e displays PV , SI , and SFV . Pressing d displays the same values in
reverse sequence.
• Zoom, Scroll, and Sketch cannot be used in the TVM mode.
• Whether you should use a positive or a negative value for the present value (PV) or the
purchase price (PRC) depends on the type of calculation you are trying to perform.
• Note that graphs should be used only for reference purposes when viewing TVM mode
calculation results.
• Note that calculation results produced in this mode should be regarded as reference values
only.
• Whenever performing an actual fi nancial transaction, be sure to check any calculation
results obtained using this calculator with against the fi gures calculated by your fi nancial
institution.