
User's Manual
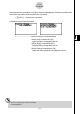
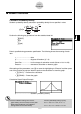
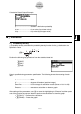
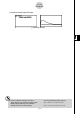
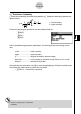
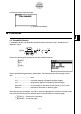

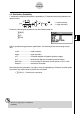
Table Of Contents
- Quick-Start
- Precautions when Using this Product
- Contents
- Getting Acquainted— Read This First!
- Chapter 1 Basic Operation
- Chapter 2 Manual Calculations
- Chapter 3 List Function
- Chapter 4 Equation Calculations
- Chapter 5 Graphing
- 5-1 Sample Graphs
- 5-2 Controlling What Appears on a Graph Screen
- 5-3 Drawing a Graph
- 5-4 Storing a Graph in Picture Memory
- 5-5 Drawing Two Graphs on the Same Screen
- 5-6 Manual Graphing
- 5-7 Using Tables
- 5-8 Dynamic Graphing
- 5-9 Graphing a Recursion Formula
- 5-10 Changing the Appearance of a Graph
- 5-11 Function Analysis
- Chapter 6 Statistical Graphs and Calculations
- Chapter 7 Financial Calculation (TVM)
- Chapter 8 Programming
- Chapter 9 Spreadsheet
- Chapter 10 eActivity
- Chapter 11 System Settings Menu
- Chapter 12 Data Communications
- Appendix
20070201
u χ
2
Distribution Probability
χ
2
distribution probability calculates the probability of χ
2
distribution data falling between two
specifi c values.
a : lower boundary
b : upper boundary
Perform the following key operations from the statistical data list.
5 (DIST)
3 (CHI)
2 (Ccd)
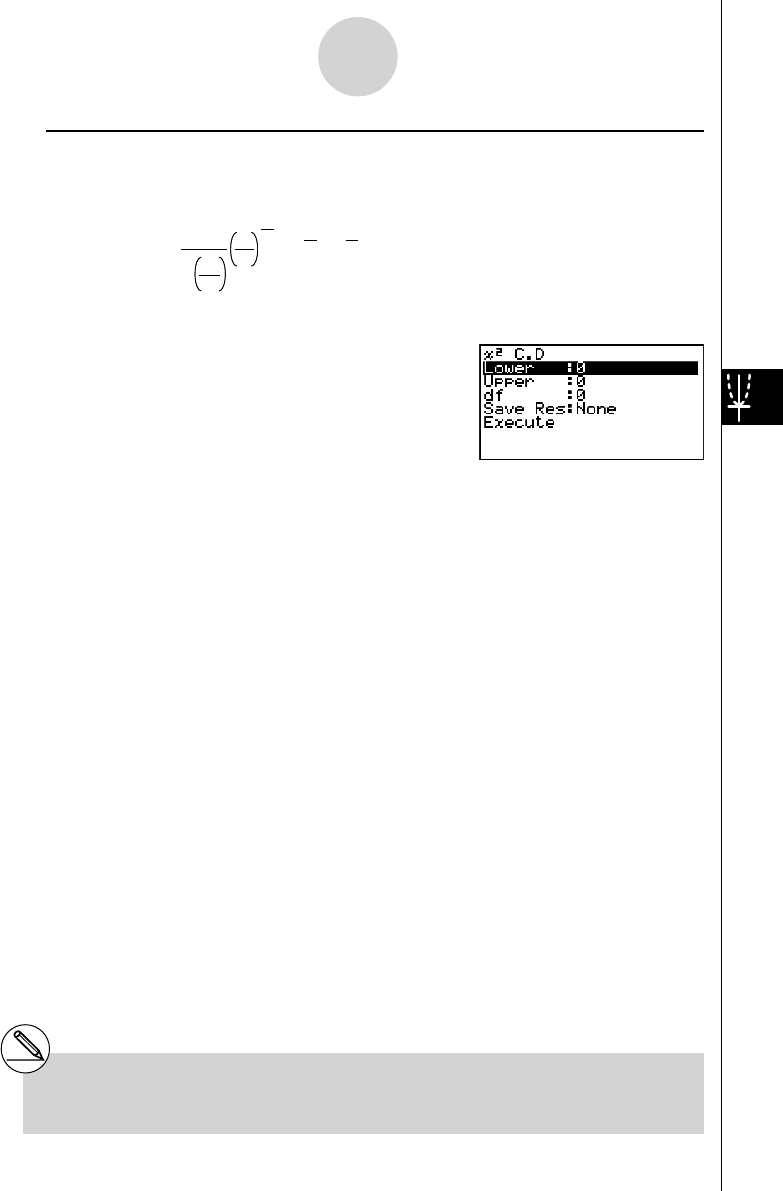
Data is specifi ed using parameter specifi cation. The following shows the meaning of each
item.
Lower .......................... lower boundary
Upper .......................... upper boundary
df ................................ degrees of freedom (positive integer)
Save Res .................... list for storage of calculation results (None or List 1 to 26)
Execute ....................... executes a calculation
After setting all the parameters, use c to move the highlighting to “Execute” and then press
the function key shown below to perform the calculation.
• 1 (CALC) ... Performs the calculation.
p =
Γ
1
2
df
df
2
x e dx
2
1
df
2
–1
x
2
–
a
b
∫
p =
Γ
1
2
df
df
2
x e dx
2
1
df
2
–1
x
2
–
a
b
∫
# There is no graphing for χ
2
distribution
probability.
6-7-11
Distribution