
User's Manual
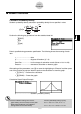
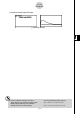
Table Of Contents
- Quick-Start
- Precautions when Using this Product
- Contents
- Getting Acquainted— Read This First!
- Chapter 1 Basic Operation
- Chapter 2 Manual Calculations
- Chapter 3 List Function
- Chapter 4 Equation Calculations
- Chapter 5 Graphing
- 5-1 Sample Graphs
- 5-2 Controlling What Appears on a Graph Screen
- 5-3 Drawing a Graph
- 5-4 Storing a Graph in Picture Memory
- 5-5 Drawing Two Graphs on the Same Screen
- 5-6 Manual Graphing
- 5-7 Using Tables
- 5-8 Dynamic Graphing
- 5-9 Graphing a Recursion Formula
- 5-10 Changing the Appearance of a Graph
- 5-11 Function Analysis
- Chapter 6 Statistical Graphs and Calculations
- Chapter 7 Financial Calculation (TVM)
- Chapter 8 Programming
- Chapter 9 Spreadsheet
- Chapter 10 eActivity
- Chapter 11 System Settings Menu
- Chapter 12 Data Communications
- Appendix
20070201
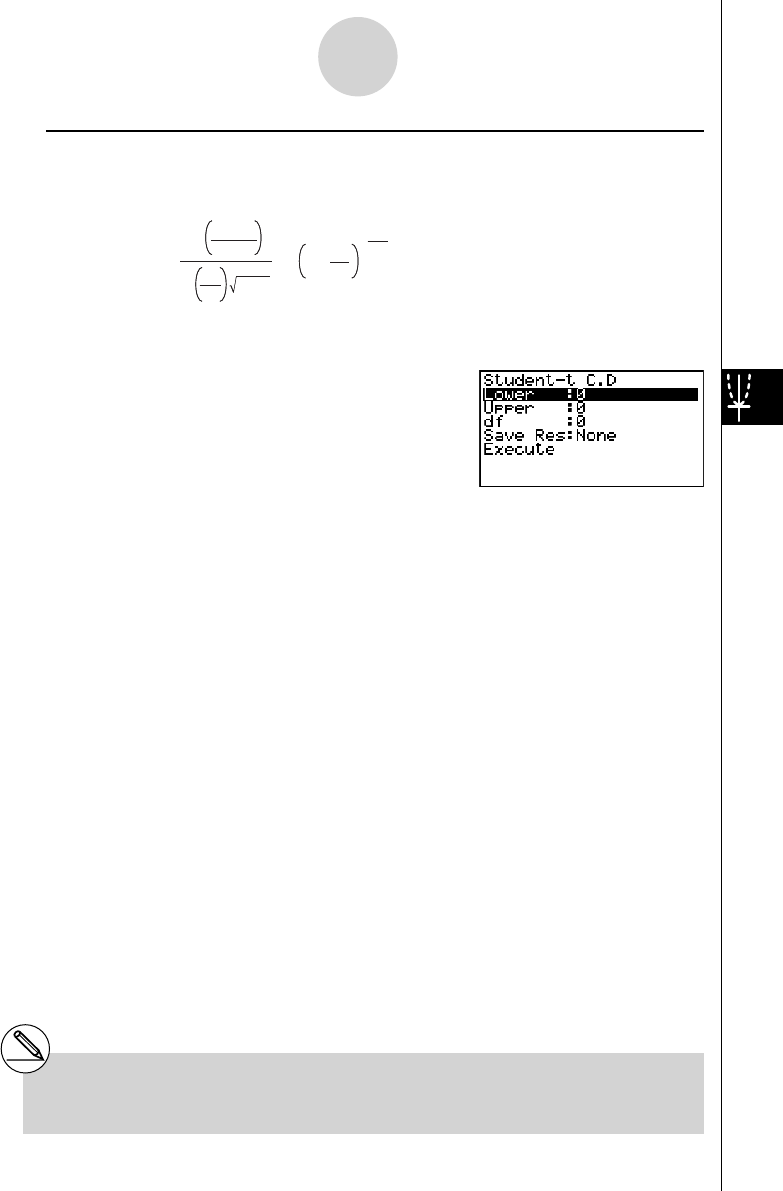
u Student- t Distribution Probability
Student- t distribution probability calculates the probability of t distribution data falling
between two specifi c values.
a : lower boundary
b : upper boundary
Perform the following key operations from the statistical data list.
5 (DIST)
2 (t)
2 (tcd)
Data is specifi ed using parameter specifi cation. The following shows the meaning of each
item.
Lower .......................... lower boundary
Upper .......................... upper boundary
df ................................ degrees of freedom ( df > 0)
Save Res .................... list for storage of calculation results (None or List 1 to 26)
Execute ....................... executes a calculation
After setting all the parameters, use c to move the highlighting to “Execute” and then press
the function key shown below to perform the calculation.
• 1 (CALC) ... Performs the calculation.
p =
Γ
Γ
df
π
2
df
2
df + 1
–
df+1
2
df
x
2
1+
d
x
a
b
∫
p =
Γ
Γ
df
π
2
df
2
df + 1
–
df+1
2
df
x
2
1+
d
x
a
b
∫
# There is no graphing for Student- t distribution
probability.
6-7-8
Distribution