
User's Manual
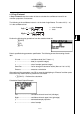

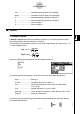
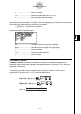
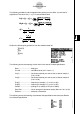
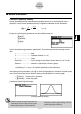
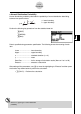
Table Of Contents
- Quick-Start
- Precautions when Using this Product
- Contents
- Getting Acquainted— Read This First!
- Chapter 1 Basic Operation
- Chapter 2 Manual Calculations
- Chapter 3 List Function
- Chapter 4 Equation Calculations
- Chapter 5 Graphing
- 5-1 Sample Graphs
- 5-2 Controlling What Appears on a Graph Screen
- 5-3 Drawing a Graph
- 5-4 Storing a Graph in Picture Memory
- 5-5 Drawing Two Graphs on the Same Screen
- 5-6 Manual Graphing
- 5-7 Using Tables
- 5-8 Dynamic Graphing
- 5-9 Graphing a Recursion Formula
- 5-10 Changing the Appearance of a Graph
- 5-11 Function Analysis
- Chapter 6 Statistical Graphs and Calculations
- Chapter 7 Financial Calculation (TVM)
- Chapter 8 Programming
- Chapter 9 Spreadsheet
- Chapter 10 eActivity
- Chapter 11 System Settings Menu
- Chapter 12 Data Communications
- Appendix
20070201
u 2-Prop Z Interval
2-Prop Z Interval uses the number of data items to calculate the confi dence interval for the
defference between the proportion of successes in two populations.
The following is the confi dence interval. α is the level of signifi cance. The value 100 (1 – α )
% is the confi dence level.
n 1 , n 2 : size of sample
x 1 , x 2 : data
Perform the following key operations from the statistical data list.
4 (INTR)
1 (Z)
4 (2-P)
Data is specifi ed using parameter specifi cation. The following shows the meaning of each
item.
C-Level ......................... confi dence level (0 < C-Level < 1)
x 1 ................................. data value ( x 1 > 0) of sample 1
n 1 ................................. size (positive integer) of sample 1
x 2 ................................. data value ( x 2 > 0) of sample 2
n 2 ................................. size (positive integer) of sample 2
Save Res ..................... list for storage of calculation results (None or List 1 to 26)
Execute ........................ executes a calculation
After setting all the parameters, use c to move the highlighting to “Execute” and then press
the function key shown below to perform the calculation.
• 1 (CALC) ... Performs the calculation.
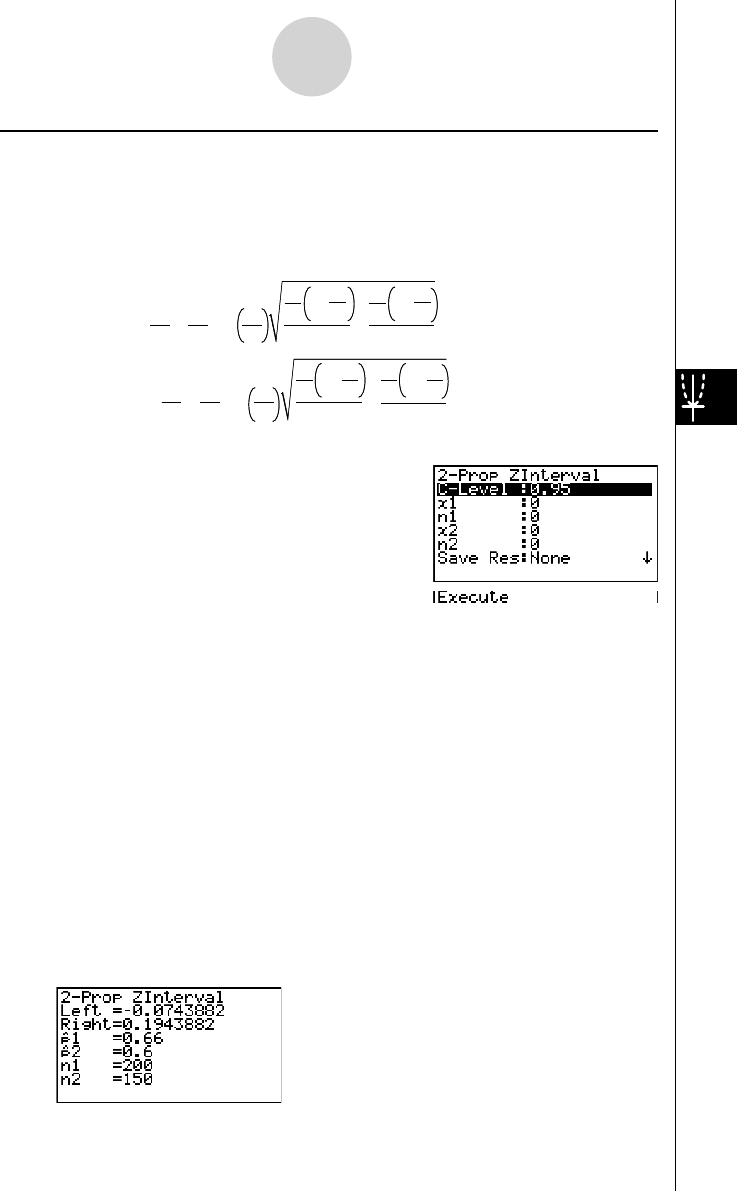
Calculation Result Output Example
Left = – – Z
α
2
x
1
n
1
x
2
n
2
n
1
n
1
x
1
1–
n
1
x
1
+
n
2
n
2
x
2
1–
n
2
x
2
R
ight = – + Z
α
2
x
1
n
1
x
2
n
2
n
1
n
1
x
1
1–
n
1
x
1
+
n
2
n
2
x
2
1–
n
2
x
2
Left = – – Z
α
2
x
1
n
1
x
2
n
2
n
1
n
1
x
1
1–
n
1
x
1
+
n
2
n
2
x
2
1–
n
2
x
2
R
ight = – + Z
α
2
x
1
n
1
x
2
n
2
n
1
n
1
x
1
1–
n
1
x
1
+
n
2
n
2
x
2
1–
n
2
x
2
6-6-7
Confi dence Interval