
User's Manual
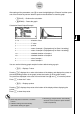
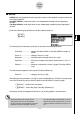
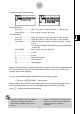
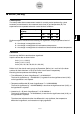
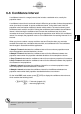
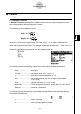
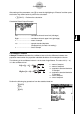
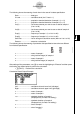
Table Of Contents
- Quick-Start
- Precautions when Using this Product
- Contents
- Getting Acquainted— Read This First!
- Chapter 1 Basic Operation
- Chapter 2 Manual Calculations
- Chapter 3 List Function
- Chapter 4 Equation Calculations
- Chapter 5 Graphing
- 5-1 Sample Graphs
- 5-2 Controlling What Appears on a Graph Screen
- 5-3 Drawing a Graph
- 5-4 Storing a Graph in Picture Memory
- 5-5 Drawing Two Graphs on the Same Screen
- 5-6 Manual Graphing
- 5-7 Using Tables
- 5-8 Dynamic Graphing
- 5-9 Graphing a Recursion Formula
- 5-10 Changing the Appearance of a Graph
- 5-11 Function Analysis
- Chapter 6 Statistical Graphs and Calculations
- Chapter 7 Financial Calculation (TVM)
- Chapter 8 Programming
- Chapter 9 Spreadsheet
- Chapter 10 eActivity
- Chapter 11 System Settings Menu
- Chapter 12 Data Communications
- Appendix
20070201
# Graphing is available with Two-Way ANOVA
only. V-Window settings are performed
automatically, regardless of Setup screen
settings.
# Using the Trace function automatically stores
the number of conditions to alpha variable A
and the mean value to variable M,
respectively.
6-5-23
Te s ts
Calculation Result Output Example
One-Way ANOVA
Line 1 (A) ...................... Factor A
df value, SS value, MS value, F value, p-value
Line 2 (ERR) ................ Error
df value, SS value, MS value
Two-Way ANOVA
Line 1 (A) ...................... Factor A
df value, SS value, MS value, F value, p-value
Line 2 (B) ...................... Factor B
df value, SS value, MS value, F value, p-value
Line 3 (AB) ................... Factor A × Factor B
df value, SS value, MS value, F value,
p-value
*Line 3 does not appear when there is only one observation
in each cell.
Line 4 (ERR) ................ Error df value, SS value, MS value
F .................................. F value
p .................................. p-value
df ................................ degrees of freedom
SS ................................ sum of squares
MS ............................... mean squares
With Two-Way ANOVA, you can draw Interaction Plot graphs. The number of graphs depends
on Factor B, while the number of X-axis data depends on the Factor A. The Y-axis is the
average value of each category.
You can use the following graph analysis function after drawing a graph.
• 1 (Trace) or !1 (TRCE) ... Trace function
Pressing d or e moves the pointer on the graph in the corresponding direction. When
there are multiple graphs, you can move between graphs by pressing f and c .
Press J to clear the pointer from the display.