
User's Manual
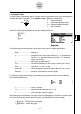
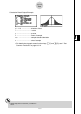
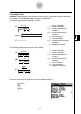
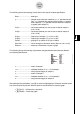
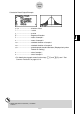
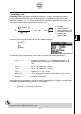
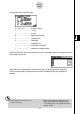
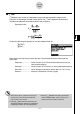

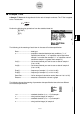
Table Of Contents
- Quick-Start
- Precautions when Using this Product
- Contents
- Getting Acquainted— Read This First!
- Chapter 1 Basic Operation
- Chapter 2 Manual Calculations
- Chapter 3 List Function
- Chapter 4 Equation Calculations
- Chapter 5 Graphing
- 5-1 Sample Graphs
- 5-2 Controlling What Appears on a Graph Screen
- 5-3 Drawing a Graph
- 5-4 Storing a Graph in Picture Memory
- 5-5 Drawing Two Graphs on the Same Screen
- 5-6 Manual Graphing
- 5-7 Using Tables
- 5-8 Dynamic Graphing
- 5-9 Graphing a Recursion Formula
- 5-10 Changing the Appearance of a Graph
- 5-11 Function Analysis
- Chapter 6 Statistical Graphs and Calculations
- Chapter 7 Financial Calculation (TVM)
- Chapter 8 Programming
- Chapter 9 Spreadsheet
- Chapter 10 eActivity
- Chapter 11 System Settings Menu
- Chapter 12 Data Communications
- Appendix
20070201
6-5-20
Te s ts
k 2-Sample F Test
2-Sample F Test tests the hypothesis for the ratio of sample variances. The F Test is applied
to the
F distribution.
Perform the following key operations from the statistical data list.
3 (TEST)
4 (F)
The following is the meaning of each item in the case of list data specifi cation.
Data .............................. data type
σ
1 ................................. population standard deviation test conditions (“G
σ
2 ”
specifi es two-tail test, “<
σ
2 ” specifi es one-tail test where
sample 1 is smaller than sample 2, “>
σ
2 ” specifi es one-tail
test where sample 1 is greater than sample 2.)
List(1) ........................... list whose contents you want to use as data of sample 1
(List 1 to 26)
List(2) ........................... list whose contents you want to use as data of sample 2
(List 1 to 26)
Freq(1).......................... frequency of sample 1 (1 or List 1 to 26)
Freq(2).......................... frequency of sample 2 (1 or List 1 to 26)
Save Res ...................... list for storage of calculation results (None or List 1 to 26)
Execute ........................ executes a calculation or draws a graph
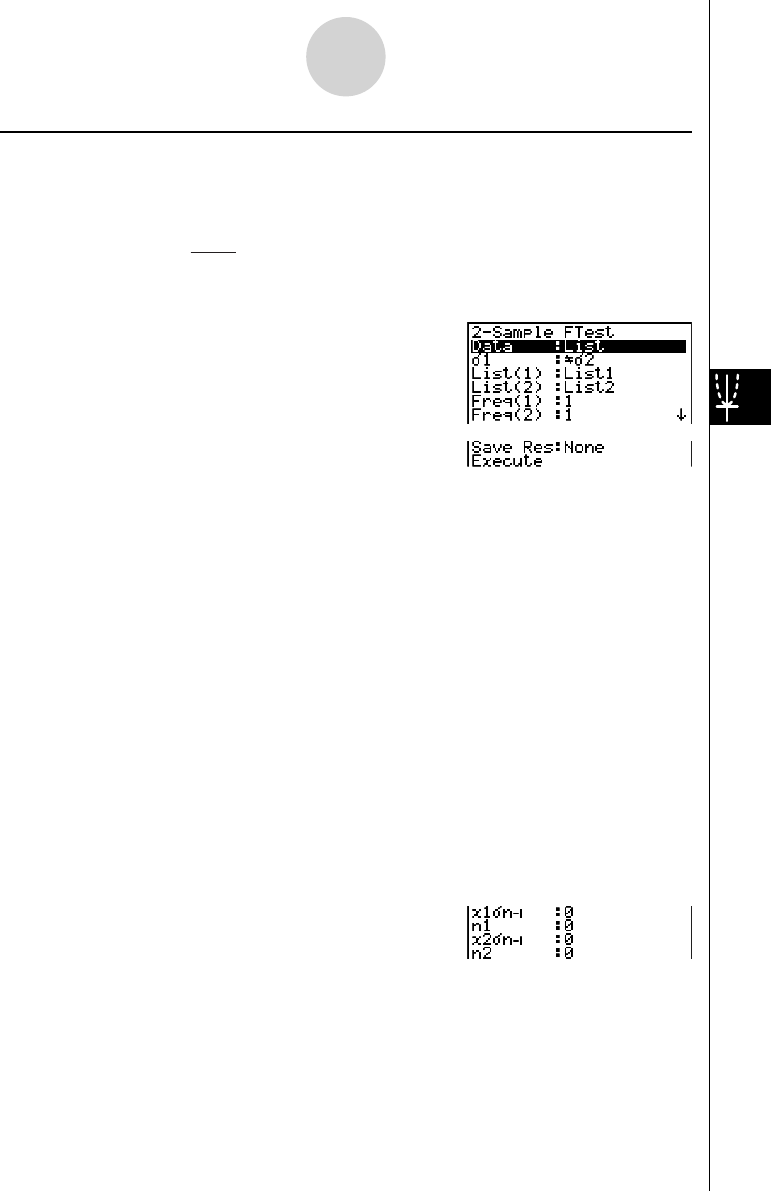
The following shows the meaning of parameter data specifi cation items that are different
from list data specifi cation.
x 1
σ
n -1 ............................ standard deviation ( x 1
σ
n -1 > 0) of sample 1
n 1 ................................. size (positive integer) of sample 1
x 2
σ
n -1 ............................ standard deviation ( x 2
σ
n -1 > 0) of sample 2
n 2 ................................. size (positive integer) of sample 2
F =
x
1 n–1
2
σ
x
2 n–1
2
σ
F =
x
1 n–1
2
σ
x
2 n–1
2
σ