
User's Manual
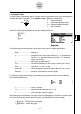
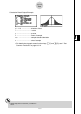
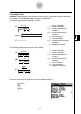
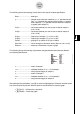
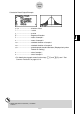
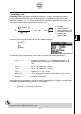
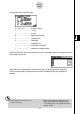
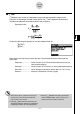

Table Of Contents
- Quick-Start
- Precautions when Using this Product
- Contents
- Getting Acquainted— Read This First!
- Chapter 1 Basic Operation
- Chapter 2 Manual Calculations
- Chapter 3 List Function
- Chapter 4 Equation Calculations
- Chapter 5 Graphing
- 5-1 Sample Graphs
- 5-2 Controlling What Appears on a Graph Screen
- 5-3 Drawing a Graph
- 5-4 Storing a Graph in Picture Memory
- 5-5 Drawing Two Graphs on the Same Screen
- 5-6 Manual Graphing
- 5-7 Using Tables
- 5-8 Dynamic Graphing
- 5-9 Graphing a Recursion Formula
- 5-10 Changing the Appearance of a Graph
- 5-11 Function Analysis
- Chapter 6 Statistical Graphs and Calculations
- Chapter 7 Financial Calculation (TVM)
- Chapter 8 Programming
- Chapter 9 Spreadsheet
- Chapter 10 eActivity
- Chapter 11 System Settings Menu
- Chapter 12 Data Communications
- Appendix
20070201
# The matrix must be at least two lines by two
columns. An error occurs if the matrix has
only one line or one column.
# Pressing 1 (Mat) while the “Observed” and
“Expected” parameter settings are highlighted
will display the Matrix (A to Z) setting screen.
6-5-18
Te s ts
# Pressing 2 (' MAT) while setting parameters
enters the Matrix Editor, which you can use to
edit and view the contents of matrices.
k χ
2
Test
χ
2
Test sets up a number of independent groups and tests hypothesis related to the
proportion of the sample included in each group. The χ
2
Test is applied to dichotomous
variables (variable with two possible values, such as yes/no).
Expected counts
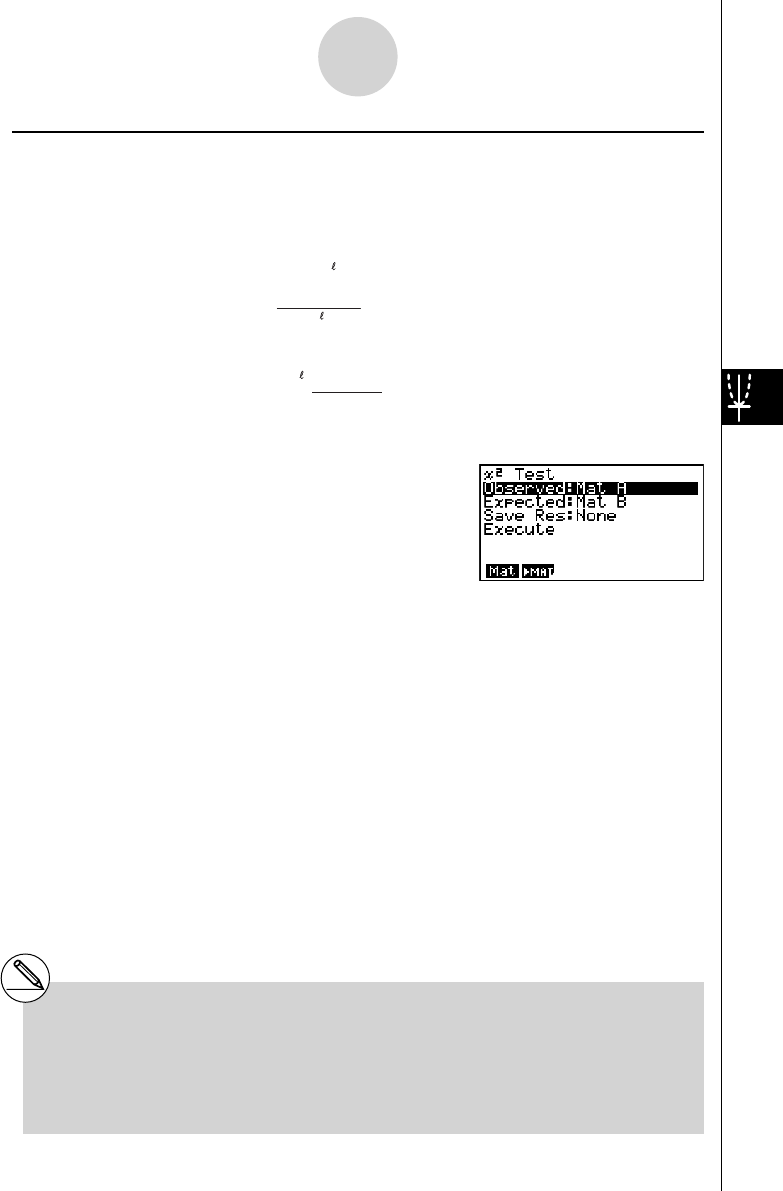
Perform the following key operations from the statistical data list.
3 (TEST)
3 (CHI)
Next, specify the matrix that contains the data. The following shows the meaning of the
above item.
Observed...................... name of matrix (A to Z) that contains observed counts (all
cells positive integers)
Expected ...................... name of matrix (A to Z) that is for saving expected frequency
Save Res ...................... list for storage of calculation results (None or List 1 to 26)
Execute ........................ executes a calculation or draws a graph
F
ij
=
Σ
x
ij
i=1
k
×
Σ
x
ij
j=1
k
ΣΣ
i=1
j=1
x
ij
F
ij
=
Σ
x
ij
i=1
k
×
Σ
x
ij
j=1
k
ΣΣ
i=1
j=1
x
ij
χ
2
=
ΣΣ
F
ij
i=1
k
(x
ij
– F
ij
)
2
j=1
χ
2
=
ΣΣ
F
ij
i=1
k
(x
ij
– F
ij
)
2
j=1