
User's Manual
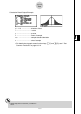
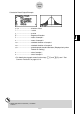
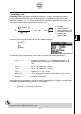

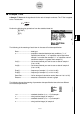
Table Of Contents
- Quick-Start
- Precautions when Using this Product
- Contents
- Getting Acquainted— Read This First!
- Chapter 1 Basic Operation
- Chapter 2 Manual Calculations
- Chapter 3 List Function
- Chapter 4 Equation Calculations
- Chapter 5 Graphing
- 5-1 Sample Graphs
- 5-2 Controlling What Appears on a Graph Screen
- 5-3 Drawing a Graph
- 5-4 Storing a Graph in Picture Memory
- 5-5 Drawing Two Graphs on the Same Screen
- 5-6 Manual Graphing
- 5-7 Using Tables
- 5-8 Dynamic Graphing
- 5-9 Graphing a Recursion Formula
- 5-10 Changing the Appearance of a Graph
- 5-11 Function Analysis
- Chapter 6 Statistical Graphs and Calculations
- Chapter 7 Financial Calculation (TVM)
- Chapter 8 Programming
- Chapter 9 Spreadsheet
- Chapter 10 eActivity
- Chapter 11 System Settings Menu
- Chapter 12 Data Communications
- Appendix
20070201
# [Save Res] does not save the
β
&
ρ
conditions in line 2.
# When the list specifi ed by [Save Res] is the
same list specifi ed by the [Resid List] item
on the Setup screen, only [Resid List] data is
saved in the list.
6-5-17
Te s ts
Calculation Result Output Example
β
G 0 &
ρ
G 0 ............... direction of test
t ................................... t score
p .................................. p-value
df ................................. degrees of freedom
a .................................. constant term
b .................................. coeffi cient
s ................................... standard error
r ................................... correlation coeffi cient
r
2
................................. coeffi cient of determination
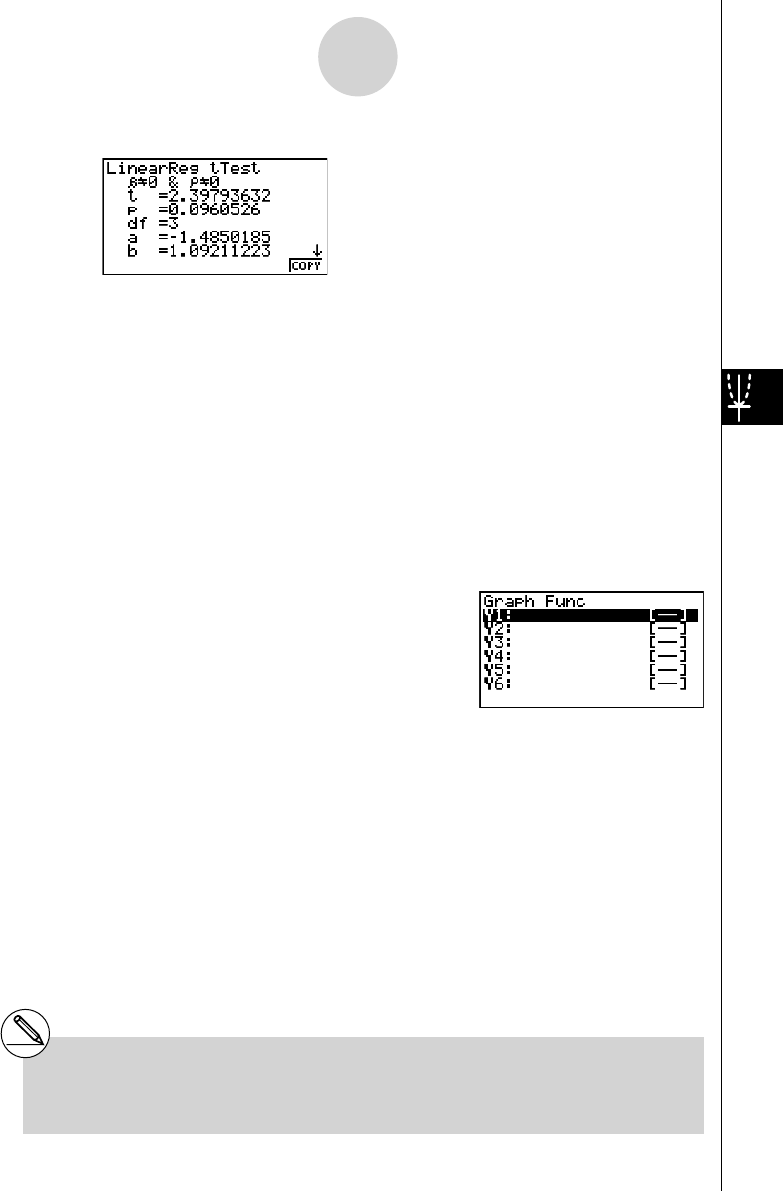
Pressing 6 (COPY) while a calculation result is on the display copies the regression formula
to the graph relation list.
When there is a list specifi ed for the [Resid List] item on the Setup screen, regression
formula residual data is automatically saved to the specifi ed list after the calculation is
fi nished.