
User's Manual
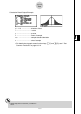
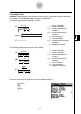
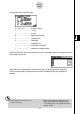

Table Of Contents
- Quick-Start
- Precautions when Using this Product
- Contents
- Getting Acquainted— Read This First!
- Chapter 1 Basic Operation
- Chapter 2 Manual Calculations
- Chapter 3 List Function
- Chapter 4 Equation Calculations
- Chapter 5 Graphing
- 5-1 Sample Graphs
- 5-2 Controlling What Appears on a Graph Screen
- 5-3 Drawing a Graph
- 5-4 Storing a Graph in Picture Memory
- 5-5 Drawing Two Graphs on the Same Screen
- 5-6 Manual Graphing
- 5-7 Using Tables
- 5-8 Dynamic Graphing
- 5-9 Graphing a Recursion Formula
- 5-10 Changing the Appearance of a Graph
- 5-11 Function Analysis
- Chapter 6 Statistical Graphs and Calculations
- Chapter 7 Financial Calculation (TVM)
- Chapter 8 Programming
- Chapter 9 Spreadsheet
- Chapter 10 eActivity
- Chapter 11 System Settings Menu
- Chapter 12 Data Communications
- Appendix
20070201
u LinearReg t Test
LinearReg t Test treats paired-variable data sets as ( x , y ) pairs, and uses the method
of least squares to determine the most appropriate
a , b coeffi cients of the data for the
regression formula y = a + bx . It also determines the correlation coeffi cient and t value, and
calculates the extent of the relationship between x and y .
a : intercept
b : slope of the line
n : size of sample ( n > 3)
r : correlation coeffi cient
r
2
: coeffi cient of
determination
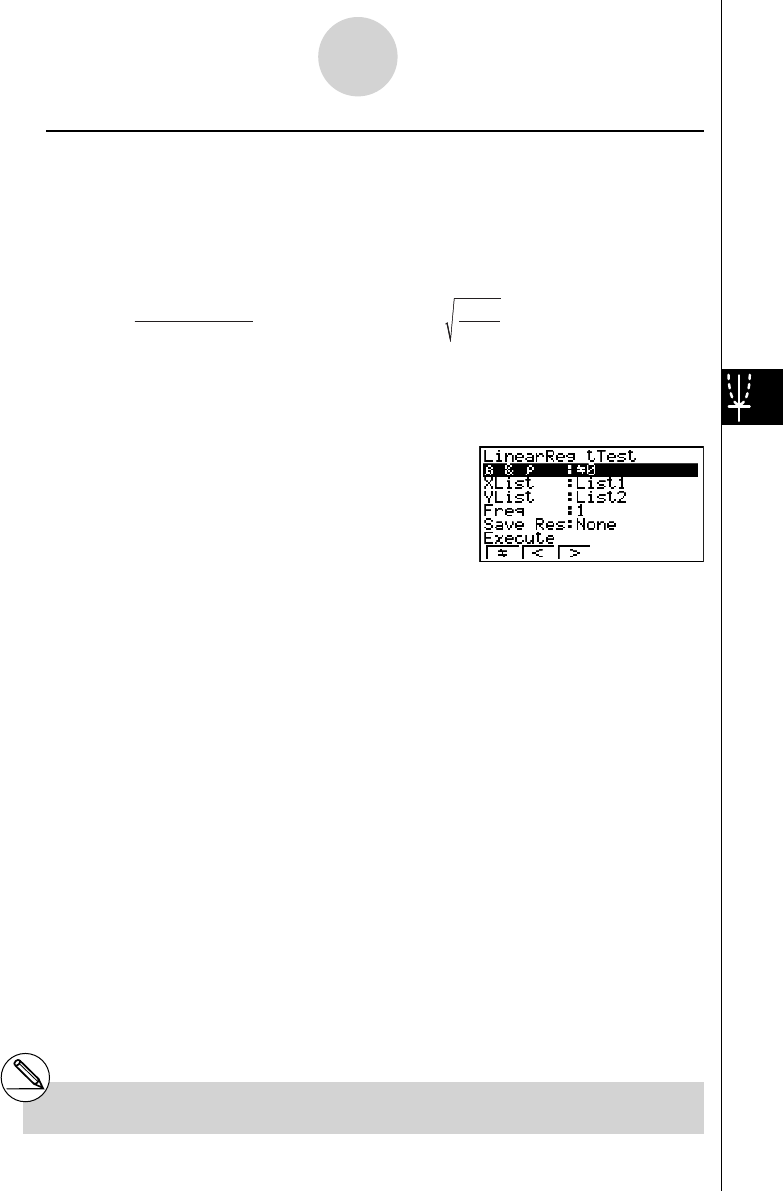
Perform the following key operations from the statistical data list.
3 (TEST)
2 (t)
3 (REG)
The following shows the meaning of each item in the case of list data specifi cation.
β
&
ρ
............................ p-value test conditions (“G 0” specifi es two-tail test, “< 0”
specifi es lower one-tail test, “> 0” specifi es upper one-tail
test.)
XList ............................. list for
x -axis data (List 1 to 26)
YList ............................. list for
y -axis data (List 1 to 26)
Freq .............................. frequency (1 or List 1 to 26)
Save Res ...................... list for storage of calculation results (None or List 1 to 26)
Execute ........................ executes a calculation
After setting all the parameters, use c to move the highlighting to “Execute” and then press
the function key shown below to perform the calculation.
• 1 (CALC) ... Performs the calculation.
b =
Σ
( x – o)( y – p)
i=1
n
Σ
(x – o)
2
i=1
n
a = p – bo t = r
n – 2
1 – r
2
b =
Σ
( x – o)( y – p)
i=1
n
Σ
(x – o)
2
i=1
n
a = p – bo t = r
n – 2
1 – r
2
# You cannot draw a graph for LinearReg t Test.
6-5-16
Te s ts