
User's Manual
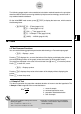
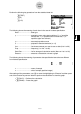
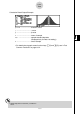
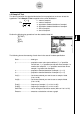

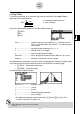
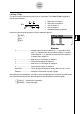
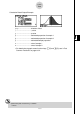
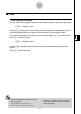
Table Of Contents
- Quick-Start
- Precautions when Using this Product
- Contents
- Getting Acquainted— Read This First!
- Chapter 1 Basic Operation
- Chapter 2 Manual Calculations
- Chapter 3 List Function
- Chapter 4 Equation Calculations
- Chapter 5 Graphing
- 5-1 Sample Graphs
- 5-2 Controlling What Appears on a Graph Screen
- 5-3 Drawing a Graph
- 5-4 Storing a Graph in Picture Memory
- 5-5 Drawing Two Graphs on the Same Screen
- 5-6 Manual Graphing
- 5-7 Using Tables
- 5-8 Dynamic Graphing
- 5-9 Graphing a Recursion Formula
- 5-10 Changing the Appearance of a Graph
- 5-11 Function Analysis
- Chapter 6 Statistical Graphs and Calculations
- Chapter 7 Financial Calculation (TVM)
- Chapter 8 Programming
- Chapter 9 Spreadsheet
- Chapter 10 eActivity
- Chapter 11 System Settings Menu
- Chapter 12 Data Communications
- Appendix
20070201
u 1-Prop Z Test
This test is used to test for an unknown proportion of successes. The 1-Prop Z Test is
applied to the normal distribution.
p 0 : expected sample proportion
n : size of sample
Perform the following key operations from the statistical data list.
3 (TEST)
1 (Z)
3 (1-P)
Prop .............................. sample proportion test conditions (“G
p 0 ” specifi es two-tail
test, “< p 0 ” specifi es lower one-tail test, “> p 0 ” specifi es upper
one-tail test.)
p 0 ................................. expected sample proportion (0 < p 0 < 1)
x .................................. sample value ( x > 0 integer)
n .................................. size of sample (positive integer)
Save Res ...................... list for storage of calculation results (None or List 1 to 26)
Execute ........................ executes a calculation or draws a graph
After setting all the parameters, use c to move the highlighting to “Execute” and then press
one of the function keys shown below to perform the calculation or draw the graph.
• 1 (CALC) ... Performs the calculation.
• 6 (DRAW) ... Draws the graph.
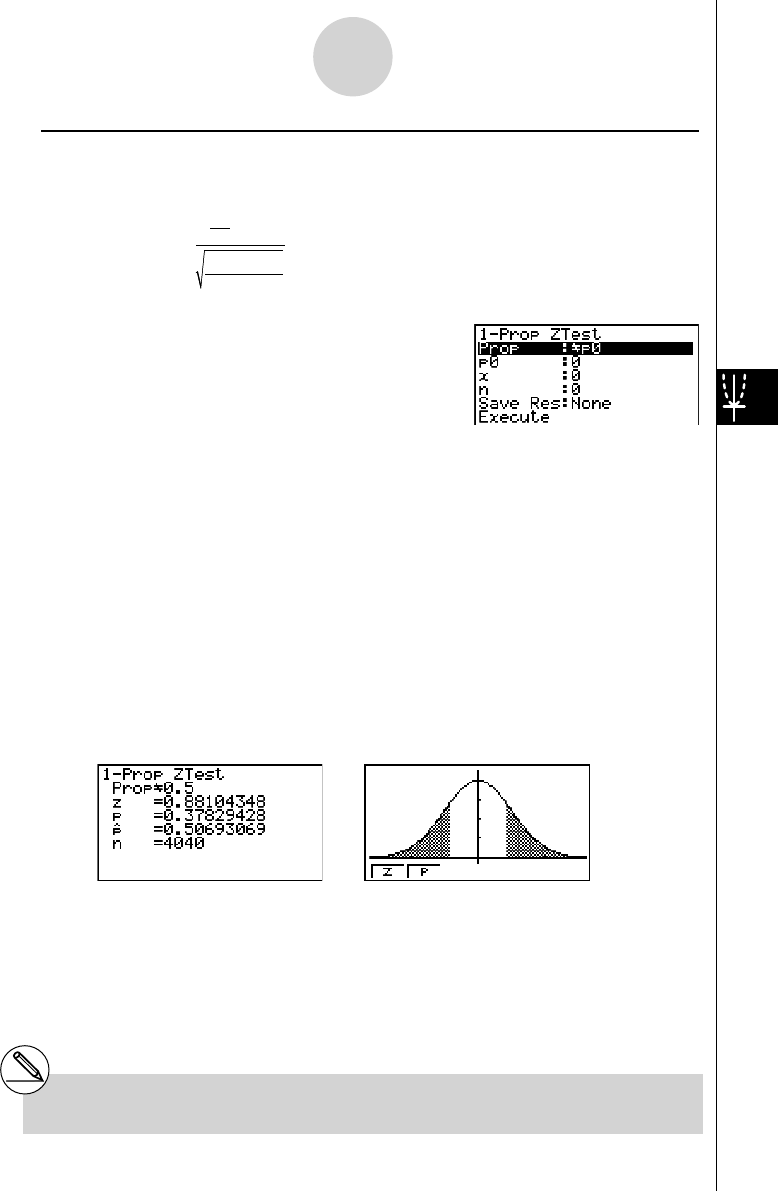
Calculation Result Output Example
PropG 0.5 ...................... direction of test
z .................................... z score
p ................................... p-value
ˆ p ................................... estimated sample proportion
n ................................... size of sample
• For details about graph screen function keys 1 (Z) and 2 (P), see “ Z Test
Common Functions” on page 6-5-2.
Z
=
n
x
n
p
0
(1– p
0
)
– p
0
Z
=
n
x
n
p
0
(1– p
0
)
– p
0
# [Save Res] does not save the Prop condition
in line 2.
6-5-7
Te s ts