
User's Manual
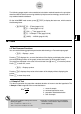
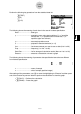
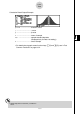
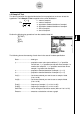

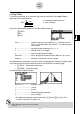
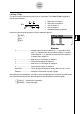
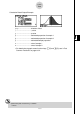
Table Of Contents
- Quick-Start
- Precautions when Using this Product
- Contents
- Getting Acquainted— Read This First!
- Chapter 1 Basic Operation
- Chapter 2 Manual Calculations
- Chapter 3 List Function
- Chapter 4 Equation Calculations
- Chapter 5 Graphing
- 5-1 Sample Graphs
- 5-2 Controlling What Appears on a Graph Screen
- 5-3 Drawing a Graph
- 5-4 Storing a Graph in Picture Memory
- 5-5 Drawing Two Graphs on the Same Screen
- 5-6 Manual Graphing
- 5-7 Using Tables
- 5-8 Dynamic Graphing
- 5-9 Graphing a Recursion Formula
- 5-10 Changing the Appearance of a Graph
- 5-11 Function Analysis
- Chapter 6 Statistical Graphs and Calculations
- Chapter 7 Financial Calculation (TVM)
- Chapter 8 Programming
- Chapter 9 Spreadsheet
- Chapter 10 eActivity
- Chapter 11 System Settings Menu
- Chapter 12 Data Communications
- Appendix

20070201
The following pages explain various statistical calculation methods based on the principles
described above. Details concerning statistical principles and terminology can be found in
any standard statistics textbook.
On the initial STAT mode screen, press 3 (TEST) to display the test menu, which contains
the following items.
• 3 (TEST)1 (Z) ... Z Tests (page 6-5-2)
2 (t) ...
t Tests (page 6-5-10)
3 (CHI) ... χ
2
Test (page 6-5-18)
4 (F) ... 2-Sample
F Test (page 6-5-20)
5 (ANOV) ... ANOVA (page 6-5-22)
k Z Tests
u Z Test Common Functions
You can use the following graph analysis functions after drawing a Z Test result output graph.
• 1 (Z) ... Displays z score.
Pressing 1 (Z) displays the z score at the bottom of the display, and displays the pointer at
the corresponding location in the graph (unless the location is off the graph screen).
Two points are displayed in the case of a two-tail test. Use d and e to move the pointer.
Press J to clear the z score.
• 2 (P) ... Displays p-value.
Pressing 2 (P) displays the p-value at the bottom of the display without displaying the
pointer.
Press J to clear the p-value.
u 1-Sample Z Test
This test is used when the population standard deviation is known to test the hypothesis. The
1-Sample Z Test is applied to the normal distribution.
o : mean of sample
μ
0 : assumed population mean
σ
: population standard deviation
n : size of sample
Z =
o –
0
σ
μ
n
Z =
o –
0
σ
μ
n
6-5-2
Te s ts
# The following V-Window settings are used for
drawing the graph.
Xmin = –3.2, Xmax = 3.2, Xscale = 1,
Ymin = –0.1, Ymax = 0.45, Yscale = 0.1
# Executing an analysis function automatically
stores the z and p values in alpha variables Z
and P, respectively.