
User's Manual
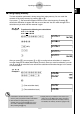
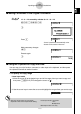
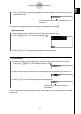
Table Of Contents
- Quick-Start
- Precautions when Using this Product
- Contents
- Getting Acquainted— Read This First!
- Chapter 1 Basic Operation
- Chapter 2 Manual Calculations
- Chapter 3 List Function
- Chapter 4 Equation Calculations
- Chapter 5 Graphing
- 5-1 Sample Graphs
- 5-2 Controlling What Appears on a Graph Screen
- 5-3 Drawing a Graph
- 5-4 Storing a Graph in Picture Memory
- 5-5 Drawing Two Graphs on the Same Screen
- 5-6 Manual Graphing
- 5-7 Using Tables
- 5-8 Dynamic Graphing
- 5-9 Graphing a Recursion Formula
- 5-10 Changing the Appearance of a Graph
- 5-11 Function Analysis
- Chapter 6 Statistical Graphs and Calculations
- Chapter 7 Financial Calculation (TVM)
- Chapter 8 Programming
- Chapter 9 Spreadsheet
- Chapter 10 eActivity
- Chapter 11 System Settings Menu
- Chapter 12 Data Communications
- Appendix
20070201
k Normal Display
The calculator normally displays values up to 10 digits long. Values that exceed this limit are
automatically converted to and displayed in exponential format.
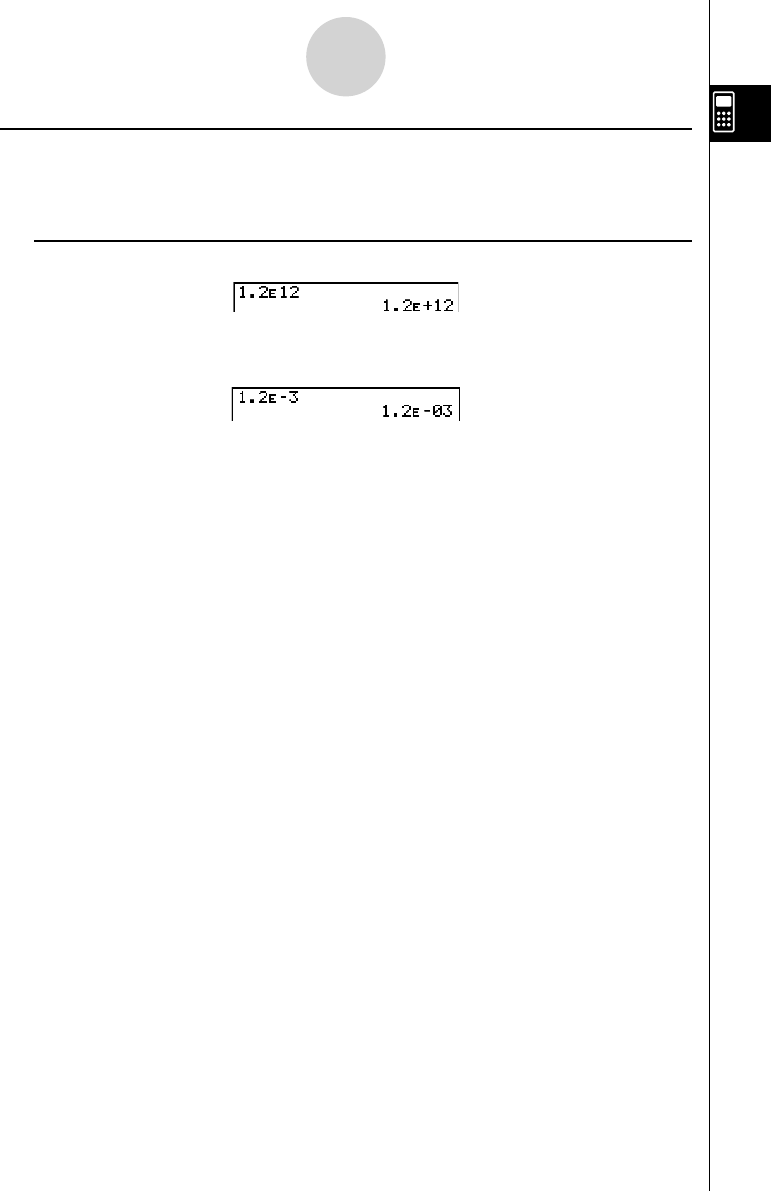
u How to interpret exponential format
1.2 E +12 indicates that the result is equivalent to 1.2 × 10
12
. This means that you should move
the decimal point in 1.2 twelve places to the right, because the exponent is positive. This
results in the value 1,200,000,000,000.
1.2
E –03 indicates that the result is equivalent to 1.2 × 10
–3
. This means that you should move
the decimal point in 1.2 three places to the left, because the exponent is negative. This
results in the value 0.0012.
You can specify one of two different ranges for automatic changeover to normal display.
Norm 1 ................... 10
–2
(0.01) > | x |, | x | > 10
10
Norm 2 ................... 10
–9
(0.000000001) > | x |, | x | > 10
10
All of the examples in this manual show calculation results using Norm 1.
See page 2-3-2 for details on switching between Norm 1 and Norm 2.
1-2-4
Display