
User's Manual
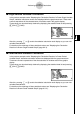
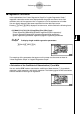
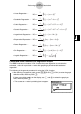
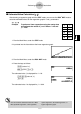
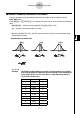
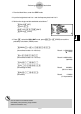
Table Of Contents
- Quick-Start
- Precautions when Using this Product
- Contents
- Getting Acquainted— Read This First!
- Chapter 1 Basic Operation
- Chapter 2 Manual Calculations
- Chapter 3 List Function
- Chapter 4 Equation Calculations
- Chapter 5 Graphing
- 5-1 Sample Graphs
- 5-2 Controlling What Appears on a Graph Screen
- 5-3 Drawing a Graph
- 5-4 Storing a Graph in Picture Memory
- 5-5 Drawing Two Graphs on the Same Screen
- 5-6 Manual Graphing
- 5-7 Using Tables
- 5-8 Dynamic Graphing
- 5-9 Graphing a Recursion Formula
- 5-10 Changing the Appearance of a Graph
- 5-11 Function Analysis
- Chapter 6 Statistical Graphs and Calculations
- Chapter 7 Financial Calculation (TVM)
- Chapter 8 Programming
- Chapter 9 Spreadsheet
- Chapter 10 eActivity
- Chapter 11 System Settings Menu
- Chapter 12 Data Communications
- Appendix
20070201
1. From the Main Menu, enter the STAT mode.
2. Input the height data into List 1 and the frequency data into List 2.
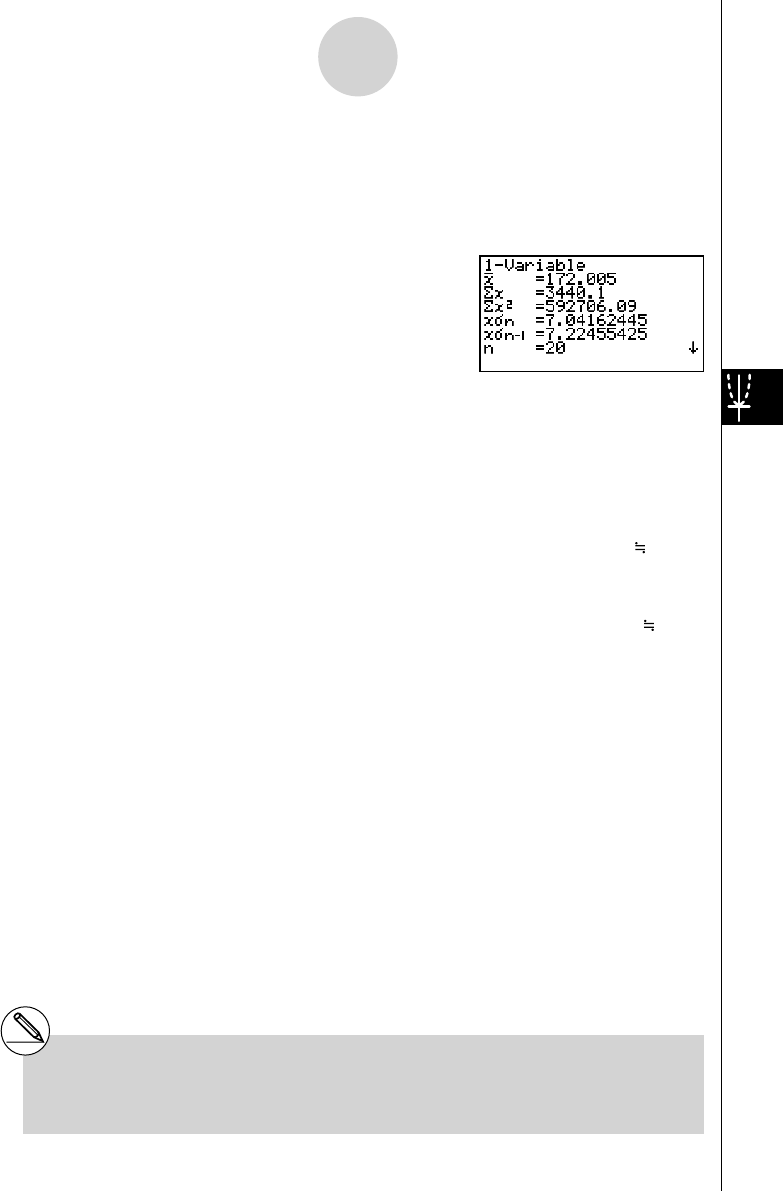
3. Perform the single-variable statistical calculations.*
1
2 (CALC)6 (SET)
1 (LIST)b w
c 2 (LIST)c w!J (QUIT)
2 (CALC)1 (1VAR)
4. Press m , select the RUN
•
MAT mode, press K 6 (g )3 (PROB) to recall the
probability calculation (PROB) menu.
3 (PROB)6 (g )4 ( t () bga.f) w
(Normalized variate
t for 160.5cm) Result: –1.633855948
( –1.634)
4 ( t () bhf.f) w
(Normalized variate
t for 175.5cm) Result: 0.4963343361
( 0.496)
1 (P()a.ejg)-
1 (P()- b.gde) w
(Percentage of total) Result: 0.638921
(63.9% of total)
3 (R()a.ejg) w
(Percentile) Result: 0.30995
(31.0 percentile)
6-4-8
Performing Statistical Calculations
*
1
You can obtain the normalized variate
immediately after performing single-variable
statistical calculations only.