
User's Manual
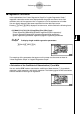
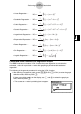
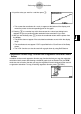
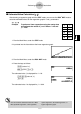
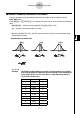
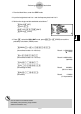
Table Of Contents
- Quick-Start
- Precautions when Using this Product
- Contents
- Getting Acquainted— Read This First!
- Chapter 1 Basic Operation
- Chapter 2 Manual Calculations
- Chapter 3 List Function
- Chapter 4 Equation Calculations
- Chapter 5 Graphing
- 5-1 Sample Graphs
- 5-2 Controlling What Appears on a Graph Screen
- 5-3 Drawing a Graph
- 5-4 Storing a Graph in Picture Memory
- 5-5 Drawing Two Graphs on the Same Screen
- 5-6 Manual Graphing
- 5-7 Using Tables
- 5-8 Dynamic Graphing
- 5-9 Graphing a Recursion Formula
- 5-10 Changing the Appearance of a Graph
- 5-11 Function Analysis
- Chapter 6 Statistical Graphs and Calculations
- Chapter 7 Financial Calculation (TVM)
- Chapter 8 Programming
- Chapter 9 Spreadsheet
- Chapter 10 eActivity
- Chapter 11 System Settings Menu
- Chapter 12 Data Communications
- Appendix
20070201
k Normal Probability Distribution Calculation
You can calculate normal probability distributions for single-variable statistics with the
RUN
•
MAT mode.
Press K 6 (g )3 (PROB)6 (g ) to display a function menu, which contains the following
items.
• { P( } / { Q( } / { R( } ... obtains normal probability {P(
t )}/{Q( t )}/{R( t )} value
• {
t ( } ... {obtains normalized variate t ( x ) value}
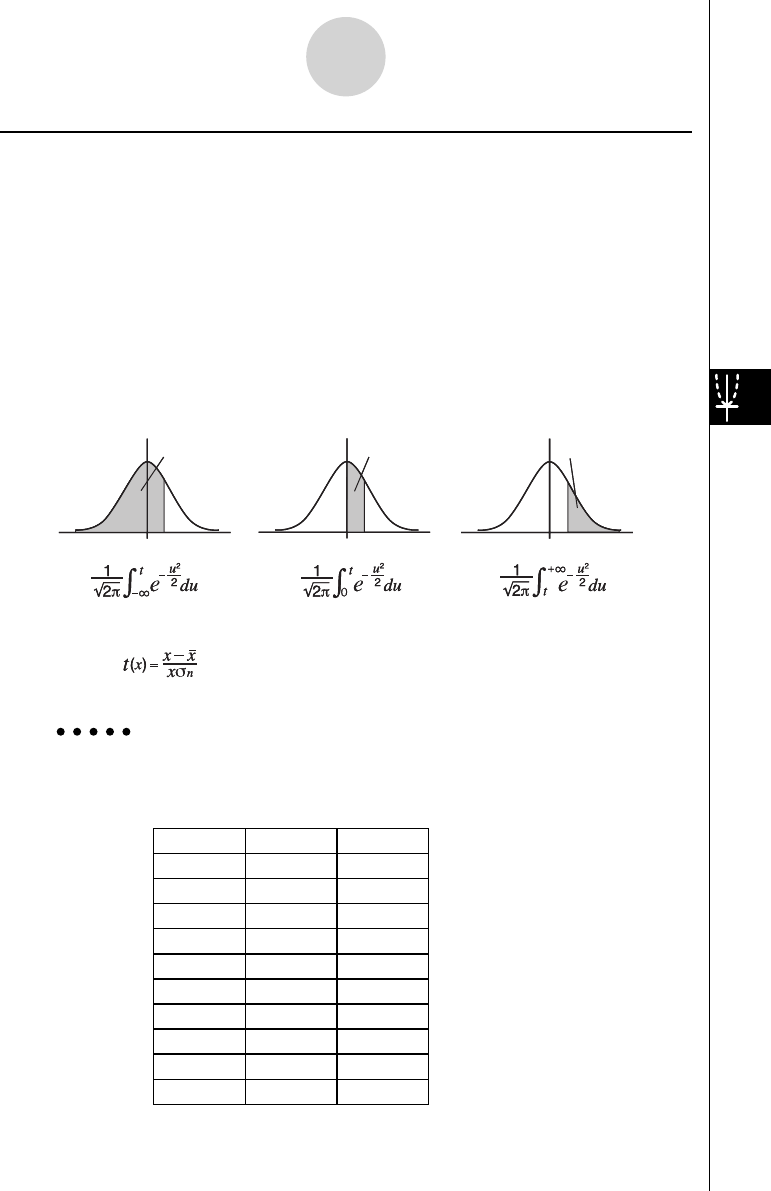
• Normal probability P(
t ), Q( t ), and R( t ), and normalized variate t ( x ) are calculated using
the following formulas.
Standard Normal Distribution
Example The following table shows the results of measurements of the height
of 20 college students. Determine what percentage of the students fall
in the range 160.5 cm to 175.5 cm. Also, in what percentile does the
175.5 cm tall student fall?
Class no. Height (cm) Frequency
1 158.5 1
2 160.5 1
3 163.3 2
4 167.5 2
5 170.2 3
6 173.3 4
7 175.5 2
8 178.6 2
9 180.4 2
10 186.7 1
P
(
t
)Q
(
t
)R
(
t
)
tt t
00 0
P
(
t
)Q
(
t
)R
(
t
)
tt t
00 0
6-4-7
Performing Statistical Calculations