
User's Manual
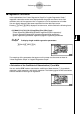
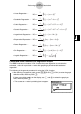
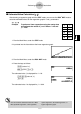
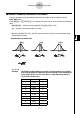
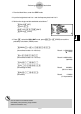
Table Of Contents
- Quick-Start
- Precautions when Using this Product
- Contents
- Getting Acquainted— Read This First!
- Chapter 1 Basic Operation
- Chapter 2 Manual Calculations
- Chapter 3 List Function
- Chapter 4 Equation Calculations
- Chapter 5 Graphing
- 5-1 Sample Graphs
- 5-2 Controlling What Appears on a Graph Screen
- 5-3 Drawing a Graph
- 5-4 Storing a Graph in Picture Memory
- 5-5 Drawing Two Graphs on the Same Screen
- 5-6 Manual Graphing
- 5-7 Using Tables
- 5-8 Dynamic Graphing
- 5-9 Graphing a Recursion Formula
- 5-10 Changing the Appearance of a Graph
- 5-11 Function Analysis
- Chapter 6 Statistical Graphs and Calculations
- Chapter 7 Financial Calculation (TVM)
- Chapter 8 Programming
- Chapter 9 Spreadsheet
- Chapter 10 eActivity
- Chapter 11 System Settings Menu
- Chapter 12 Data Communications
- Appendix
20070201
6-4-6
Performing Statistical Calculations
# You cannot obtain estimated values for a Med-
Med, quadratic regression, cubic regression,
quartic regression, sinusoidal regression, or
logistic regression graph.
xi
yi
10 1003
15 1005
20 1010
25 1011
30 1014
1. From the Main Menu, enter the STAT mode.
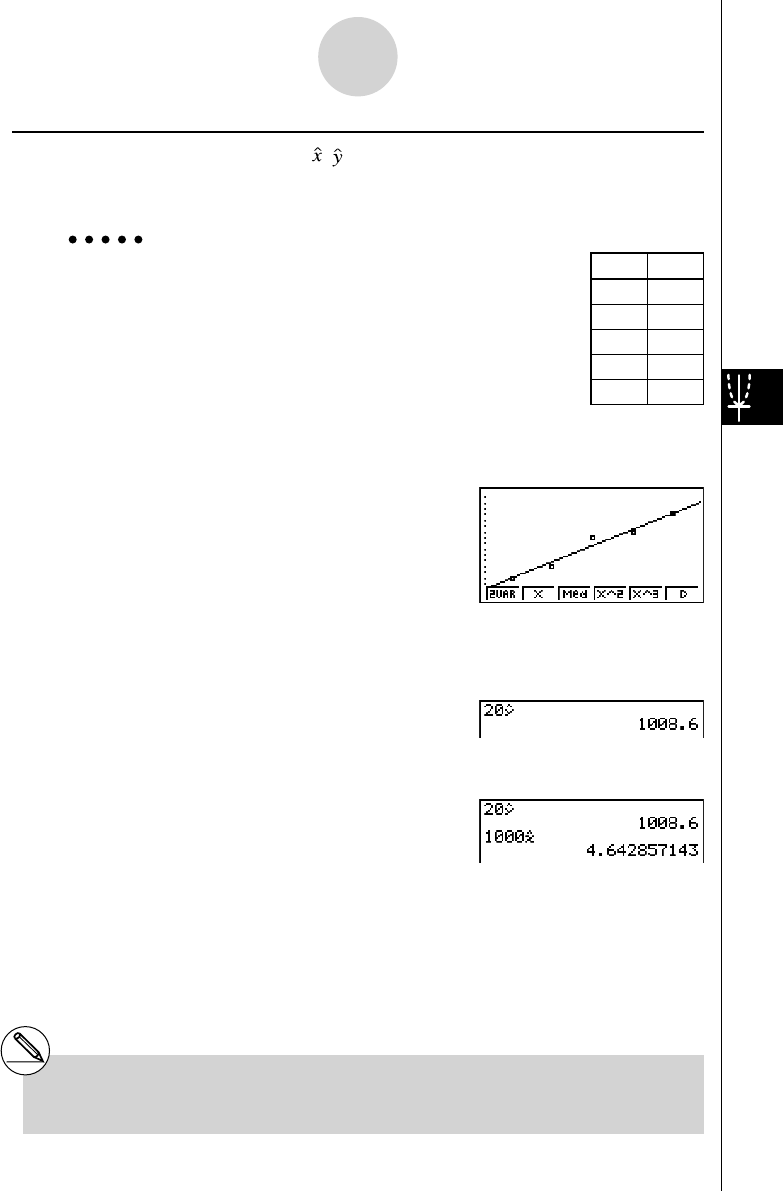
2. Input data into the list and draw the linear regression graph.
3. From the Main Menu, enter the RUN
•
MAT mode.
4. Press the keys as follows.
ca (value of xi )
K 5 (S TAT) 2 (
ŷ )w
The estimated value ŷ is displayed for xi = 20.
baaa (value of yi )
1 (
ˆ x )w
The estimated value ˆ x is displayed for yi = 1000.
k Estimated Value Calculation ( , )
After drawing a regression graph with the STAT mode, you can use the RUN
•
MAT mode to
calculate estimated values for the regression graph’s x and y parameters.
Example To perform a linear regression using the nearby data
and estimate the values of
ŷ and ̂ x when xi = 20 and
yi = 1000