
User's Manual
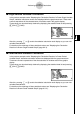
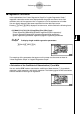
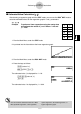
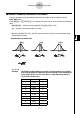
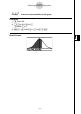
Table Of Contents
- Quick-Start
- Precautions when Using this Product
- Contents
- Getting Acquainted— Read This First!
- Chapter 1 Basic Operation
- Chapter 2 Manual Calculations
- Chapter 3 List Function
- Chapter 4 Equation Calculations
- Chapter 5 Graphing
- 5-1 Sample Graphs
- 5-2 Controlling What Appears on a Graph Screen
- 5-3 Drawing a Graph
- 5-4 Storing a Graph in Picture Memory
- 5-5 Drawing Two Graphs on the Same Screen
- 5-6 Manual Graphing
- 5-7 Using Tables
- 5-8 Dynamic Graphing
- 5-9 Graphing a Recursion Formula
- 5-10 Changing the Appearance of a Graph
- 5-11 Function Analysis
- Chapter 6 Statistical Graphs and Calculations
- Chapter 7 Financial Calculation (TVM)
- Chapter 8 Programming
- Chapter 9 Spreadsheet
- Chapter 10 eActivity
- Chapter 11 System Settings Menu
- Chapter 12 Data Communications
- Appendix
20070201
k Single-Variable Statistical Calculations
In the previous example under “Displaying the Calculation Results of a Drawn Single-Variable
Graph”, statistical calculation results were displayed after the graph was drawn. These were
numeric expressions of the characteristics of variables used in the graphic display.
These values can also be directly obtained by displaying the statistical data list and pressing
2 (CALC)1 (1VAR).
After this, pressing f or c scrolls the statistical calculation result display so you can view
variable characteristics.
For details on the meanings of these statistical values, see “Displaying the Calculation
Results of a Drawn Single-Variable Graph” (page 6-2-4).
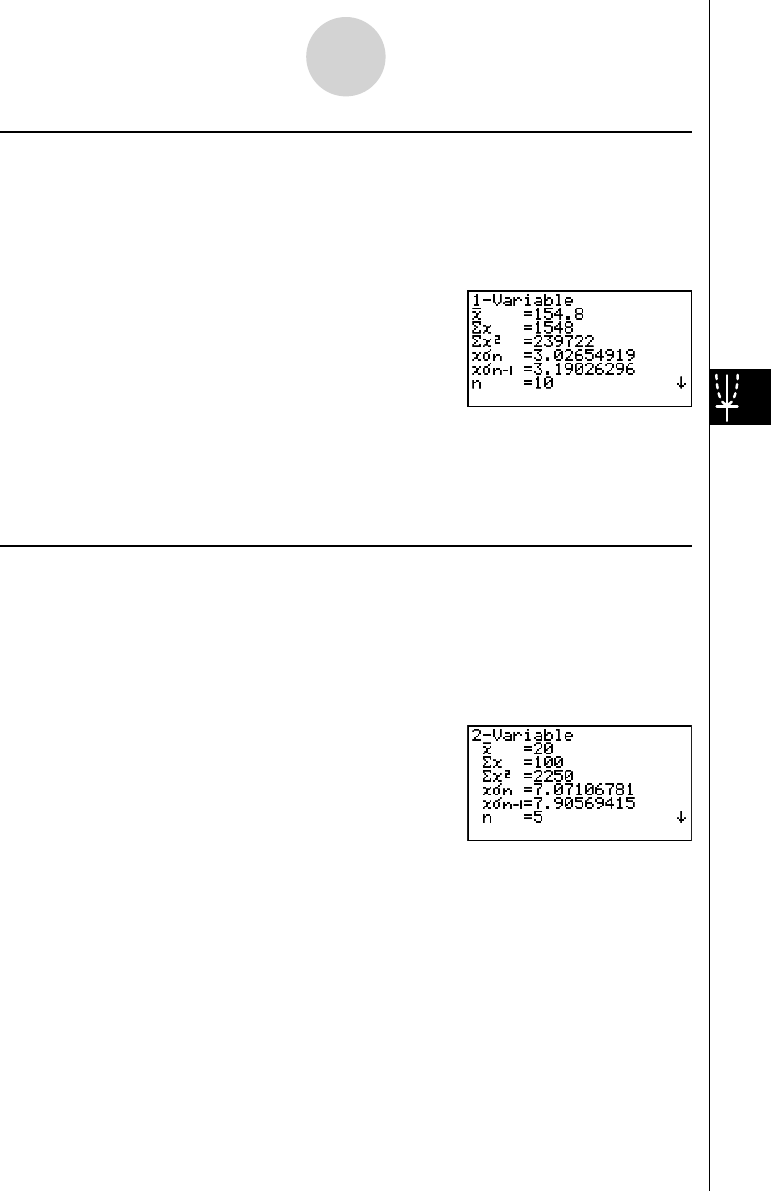
k Paired-Variable Statistical Calculations
In the previous example under “Displaying the Calculation Results of a Drawn Paired-
Variable Graph”, statistical calculation results were displayed after the graph was drawn.
These were numeric expressions of the characteristics of variables used in the graphic
display.
These values can also be directly obtained by displaying the statistical data list and pressing
2 (CALC)2 (2VAR).
After this, pressing f or c scrolls the statistical calculation result display so you can view
variable characteristics.
For details on the meanings of these statistical values, see “Displaying the Calculation
Results of a Drawn Paired-Variable Graph” (page 6-3-11).
6-4-2
Performing Statistical Calculations