
User's Manual
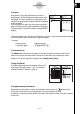

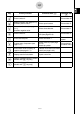
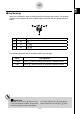
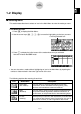
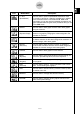
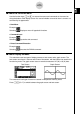
Table Of Contents
- Quick-Start
- Precautions when Using this Product
- Contents
- Getting Acquainted— Read This First!
- Chapter 1 Basic Operation
- Chapter 2 Manual Calculations
- Chapter 3 List Function
- Chapter 4 Equation Calculations
- Chapter 5 Graphing
- 5-1 Sample Graphs
- 5-2 Controlling What Appears on a Graph Screen
- 5-3 Drawing a Graph
- 5-4 Storing a Graph in Picture Memory
- 5-5 Drawing Two Graphs on the Same Screen
- 5-6 Manual Graphing
- 5-7 Using Tables
- 5-8 Dynamic Graphing
- 5-9 Graphing a Recursion Formula
- 5-10 Changing the Appearance of a Graph
- 5-11 Function Analysis
- Chapter 6 Statistical Graphs and Calculations
- Chapter 7 Financial Calculation (TVM)
- Chapter 8 Programming
- Chapter 9 Spreadsheet
- Chapter 10 eActivity
- Chapter 11 System Settings Menu
- Chapter 12 Data Communications
- Appendix

20070201
k About the Function Menu
Use the function keys (1 to 6 ) to access the menus and commands in the menu bar
along the bottom of the display screen. You can tell whether a menu bar item is a menu or a
command by its appearance.
• Next Menu
Example:
Selecting
displays a menu of hyperbolic functions.
• Command Input
Example:
Selecting
inputs the sinh command.
• Direct Command Execution
Example:
Selecting
executes the DRAW command.
k About Display Screens
This calculator uses two types of display screens: a text screen and a graph screen. The
text screen can show 21 columns and 8 lines of characters, with the bottom line used for the
function key menu. The graph screen uses an area that measures 127 (W) × 63 (H) dots.
Text Screen Graph Screen
The contents of each type of screen are stored in independent memory areas.
Press !6 (G ↔ T) to switch between the graph screen and text screen.
1-2-3
Display