
User's Manual
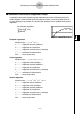
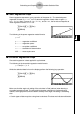
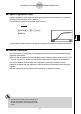
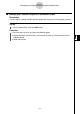
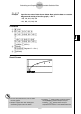
Table Of Contents
- Quick-Start
- Precautions when Using this Product
- Contents
- Getting Acquainted— Read This First!
- Chapter 1 Basic Operation
- Chapter 2 Manual Calculations
- Chapter 3 List Function
- Chapter 4 Equation Calculations
- Chapter 5 Graphing
- 5-1 Sample Graphs
- 5-2 Controlling What Appears on a Graph Screen
- 5-3 Drawing a Graph
- 5-4 Storing a Graph in Picture Memory
- 5-5 Drawing Two Graphs on the Same Screen
- 5-6 Manual Graphing
- 5-7 Using Tables
- 5-8 Dynamic Graphing
- 5-9 Graphing a Recursion Formula
- 5-10 Changing the Appearance of a Graph
- 5-11 Function Analysis
- Chapter 6 Statistical Graphs and Calculations
- Chapter 7 Financial Calculation (TVM)
- Chapter 8 Programming
- Chapter 9 Spreadsheet
- Chapter 10 eActivity
- Chapter 11 System Settings Menu
- Chapter 12 Data Communications
- Appendix
20070201
k Multiple Graphs
You can draw more than one graph on the same display by using the procedure under
“Changing Graph Parameters” to set the graph draw (On)/non-draw (Off) status of two or
all three of the graphs to draw On, and then pressing 6 (DRAW)(see page 6-1-4). After
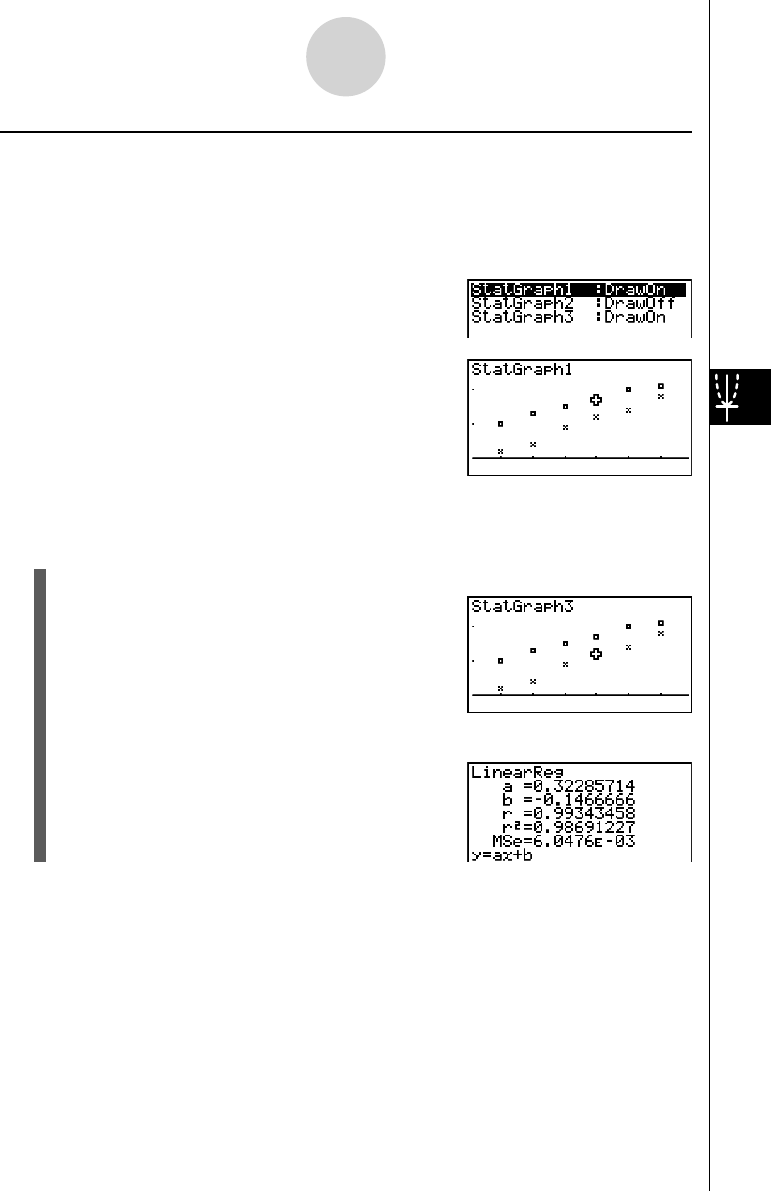
drawing the graphs, you can select which graph formula to use when performing single-
variable statistic or regression calculations.
1 (CALC)
2 (X)
• The text at the top of the screen indicates the currently selected graph (StatGraph1 =
Graph 1, StatGraph2 = Graph 2, StatGraph3 = Graph 3).
1. Press c . The graph name at the top of the screen changes when you do.
2. When the graph you want to use is selected, press w .
6-3-12
Calculating and Graphing Paired-Variable Statistical Data