
User's Manual
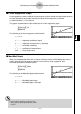
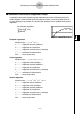
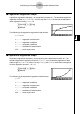
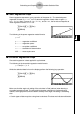
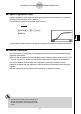
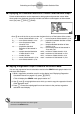
Table Of Contents
- Quick-Start
- Precautions when Using this Product
- Contents
- Getting Acquainted— Read This First!
- Chapter 1 Basic Operation
- Chapter 2 Manual Calculations
- Chapter 3 List Function
- Chapter 4 Equation Calculations
- Chapter 5 Graphing
- 5-1 Sample Graphs
- 5-2 Controlling What Appears on a Graph Screen
- 5-3 Drawing a Graph
- 5-4 Storing a Graph in Picture Memory
- 5-5 Drawing Two Graphs on the Same Screen
- 5-6 Manual Graphing
- 5-7 Using Tables
- 5-8 Dynamic Graphing
- 5-9 Graphing a Recursion Formula
- 5-10 Changing the Appearance of a Graph
- 5-11 Function Analysis
- Chapter 6 Statistical Graphs and Calculations
- Chapter 7 Financial Calculation (TVM)
- Chapter 8 Programming
- Chapter 9 Spreadsheet
- Chapter 10 eActivity
- Chapter 11 System Settings Menu
- Chapter 12 Data Communications
- Appendix
20070201
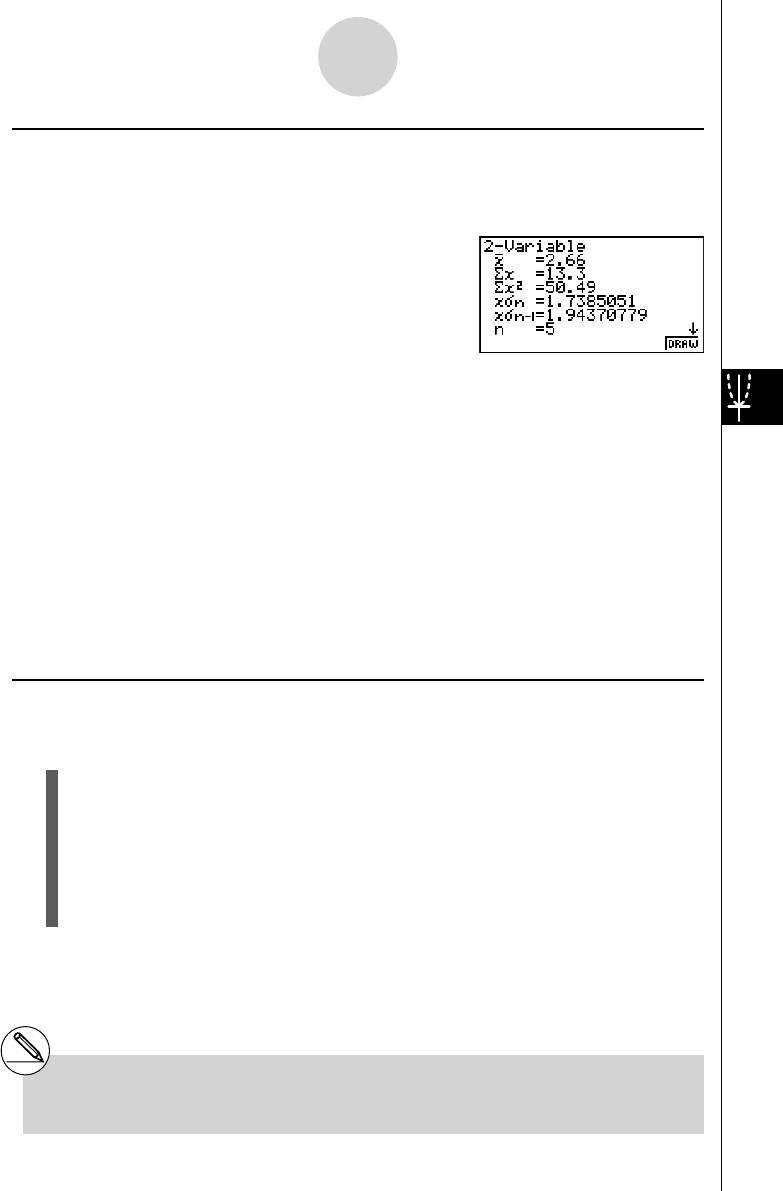
k Displaying the Calculation Results of a Drawn Paired-Variable Graph
Paired-variable statistics can be expressed as both graphs and parameter values. When
these graphs are displayed, the paired-variable calculation results appear as shown below
when you press 1 (CALC)1 (2VAR).
• Use c to scroll the list so you can view the items that run off the bottom of the screen.
o ............. mean of data stored in x List
Σ x ........... sum of data stored in x List
Σ x
2
.......... sum of squares of data
stored in x List
x
σ
n .......... population standard
deviation of data stored in
x List
x
σ
n -1 ........ sample standard deviation
of data stored in x List
n ............. number of data
p .............. mean of data stored in
y List
Σ
y ........... sum of data stored in y List
6-3-11
Calculating and Graphing Paired-Variable Statistical Data
*
1
You cannot edit regression formulas for graph
formulas in the GRAPH mode.
Σ y
2
......sum of squares of data stored in y List
y
σ
n ......population standard deviation of data
stored in y List
y
σ
n -1 ....sample standard deviation of data
stored in y List
Σ xy .......sum of the product of data stored in
x List and y List
minX ....minimum of data stored in
x List
maxX ...maximum of data stored in x List
minY ....minimum of data stored in
y List
maxY ...maximum of data stored in
y List
k Copying a Regression Graph Formula to the GRAPH Mode
You can copy regression formula calculation results to the GRAPH mode graph relation list,
and store and compare.
1. While a regression calculation result is on the display (see “Displaying Regression
Calculation Results” on page 6-3-5), press 5 (COPY).
• This will display the GRAPH mode graph relation list.*
1
2. Use f and c to highlight the area to which you want to copy the regression formula
of the displayed result.
3. Press w to save the copied graph formula and return to the previous regression
calculation result display.