
User's Manual
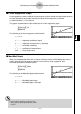
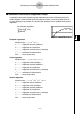
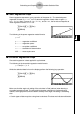
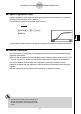
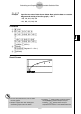
Table Of Contents
- Quick-Start
- Precautions when Using this Product
- Contents
- Getting Acquainted— Read This First!
- Chapter 1 Basic Operation
- Chapter 2 Manual Calculations
- Chapter 3 List Function
- Chapter 4 Equation Calculations
- Chapter 5 Graphing
- 5-1 Sample Graphs
- 5-2 Controlling What Appears on a Graph Screen
- 5-3 Drawing a Graph
- 5-4 Storing a Graph in Picture Memory
- 5-5 Drawing Two Graphs on the Same Screen
- 5-6 Manual Graphing
- 5-7 Using Tables
- 5-8 Dynamic Graphing
- 5-9 Graphing a Recursion Formula
- 5-10 Changing the Appearance of a Graph
- 5-11 Function Analysis
- Chapter 6 Statistical Graphs and Calculations
- Chapter 7 Financial Calculation (TVM)
- Chapter 8 Programming
- Chapter 9 Spreadsheet
- Chapter 10 eActivity
- Chapter 11 System Settings Menu
- Chapter 12 Data Communications
- Appendix
20070201
k Logarithmic Regression Graph
Logarithmic regression expresses y as a logarithmic function of x . The standard logarithmic
regression formula is
y = a + b × In x , so if we say that X = In x , the formula corresponds to
linear regression formula y = a + b X.
1 (CALC)6 (g )2 (Log)
6 (DRAW)
The following is the logarithmic regression model formula.
y = a + b ·ln x
a ...............regression constant term
b ............... regression coeffi cient
r ............... correlation coeffi cient
r
2
.............coeffi cient of determination
MSe ........mean square error
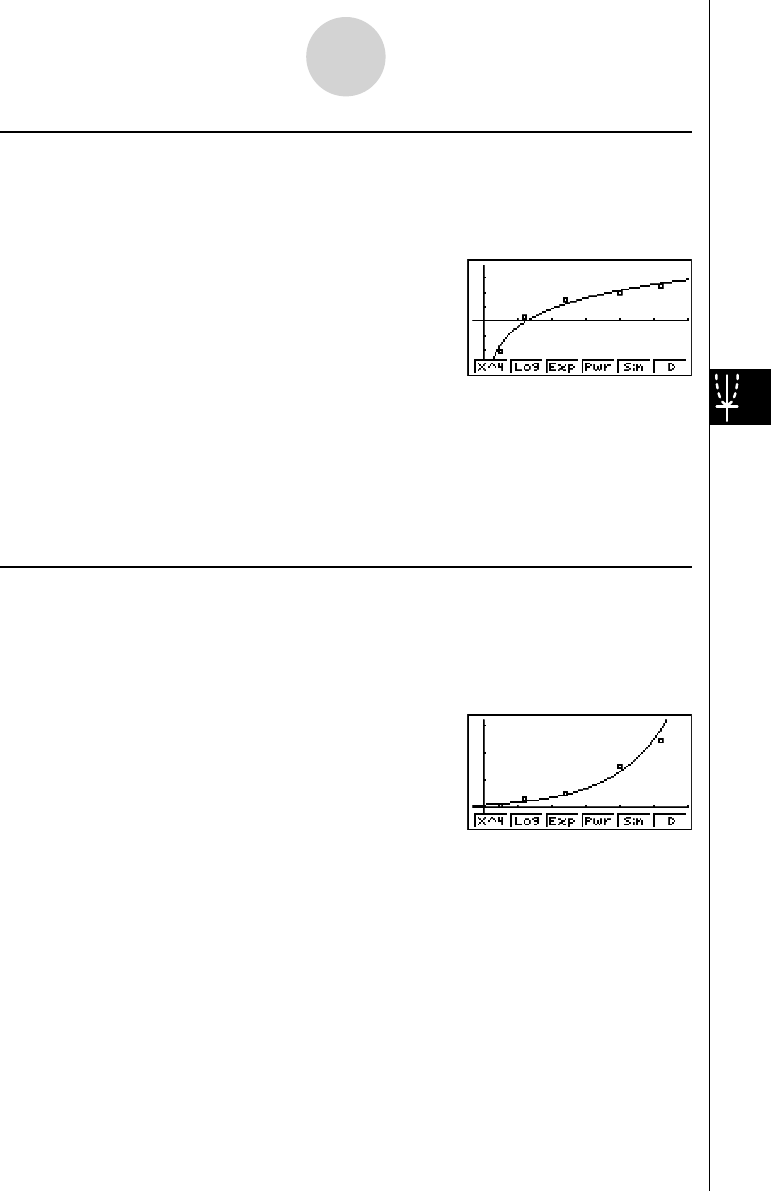
k Exponential Regression Graph
Exponential regression expresses y as a proportion of the exponential function of x . The
standard exponential regression formula is y = a × e
bx
, so if we take the logarithms of both
sides we get In y = In a + bx . Next, if we say Y = In y , and A = In a , the formula corresponds
to linear regression formula Y = A + bx .
1 (CALC)6 (g )3 (Exp)
6 (DRAW)
The following is the exponential regression model formula.
y = a · e
bx
a ...............regression coeffi cient
b ...............regression constant term
r ............... correlation coeffi cient
r
2
.............coeffi cient of determination
MSe ........mean square error
6-3-8
Calculating and Graphing Paired-Variable Statistical Data