
User's Manual
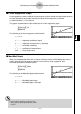
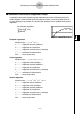
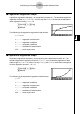
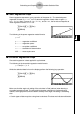
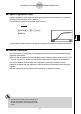
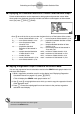
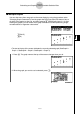
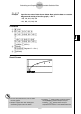
Table Of Contents
- Quick-Start
- Precautions when Using this Product
- Contents
- Getting Acquainted— Read This First!
- Chapter 1 Basic Operation
- Chapter 2 Manual Calculations
- Chapter 3 List Function
- Chapter 4 Equation Calculations
- Chapter 5 Graphing
- 5-1 Sample Graphs
- 5-2 Controlling What Appears on a Graph Screen
- 5-3 Drawing a Graph
- 5-4 Storing a Graph in Picture Memory
- 5-5 Drawing Two Graphs on the Same Screen
- 5-6 Manual Graphing
- 5-7 Using Tables
- 5-8 Dynamic Graphing
- 5-9 Graphing a Recursion Formula
- 5-10 Changing the Appearance of a Graph
- 5-11 Function Analysis
- Chapter 6 Statistical Graphs and Calculations
- Chapter 7 Financial Calculation (TVM)
- Chapter 8 Programming
- Chapter 9 Spreadsheet
- Chapter 10 eActivity
- Chapter 11 System Settings Menu
- Chapter 12 Data Communications
- Appendix

20070201
k Selecting the Regression Type
After you graph paired-variable statistical data, press 1 (CALC). Then you can use the
function menu at the bottom of the display to select from a variety of different types of
regression.
• { 2VAR } ... {paired-variable statistical results}
• { X } / { Med } / { X^2 } / { X^3 } / { X^4 } / { Log } / { Exp } / { Pwr } / { Sin } / { Lgst }
... {linear regression}/{Med-Med}/{quadratic regression}/{cubic regression}/{quartic
regression}/{logarithmic regression}/{exponential regression}/{power regression}/
{sinusoidal regression}/{logistic regression} calculation and graphing
k Displaying Regression Calculation Results
Whenever you perform a regression calculation, the regression formula parameter (such as
a and b in the linear regression y = ax + b ) calculation results appear on the display. You can
use these to obtain statistical calculation results.
Regression parameters are calculated as soon as you press a function key to select a
regression type, while a graph is on the display.
k Graphing Statistical Calculation Results
While the parameter calculation result is on the display, you can graph the displayed
regression formula by pressing 6 (DRAW).
6-3-5
Calculating and Graphing Paired-Variable Statistical Data