
User's Manual
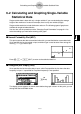
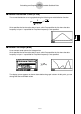
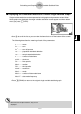
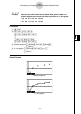
Table Of Contents
- Quick-Start
- Precautions when Using this Product
- Contents
- Getting Acquainted— Read This First!
- Chapter 1 Basic Operation
- Chapter 2 Manual Calculations
- Chapter 3 List Function
- Chapter 4 Equation Calculations
- Chapter 5 Graphing
- 5-1 Sample Graphs
- 5-2 Controlling What Appears on a Graph Screen
- 5-3 Drawing a Graph
- 5-4 Storing a Graph in Picture Memory
- 5-5 Drawing Two Graphs on the Same Screen
- 5-6 Manual Graphing
- 5-7 Using Tables
- 5-8 Dynamic Graphing
- 5-9 Graphing a Recursion Formula
- 5-10 Changing the Appearance of a Graph
- 5-11 Function Analysis
- Chapter 6 Statistical Graphs and Calculations
- Chapter 7 Financial Calculation (TVM)
- Chapter 8 Programming
- Chapter 9 Spreadsheet
- Chapter 10 eActivity
- Chapter 11 System Settings Menu
- Chapter 12 Data Communications
- Appendix
20070201
6-3-1
Calculating and Graphing Paired-Variable Statistical Data
6-3 Calculating and Graphing Paired-Variable
Statistical Data
k Drawing a Scatter Diagram and xy Line Graph
Description
The following procedure plots a scatter diagram and connects the dots to produce an xy line
graph.
Set Up
1. From the Main Menu, enter the STAT mode.
Execution
2. Input the data into a list.
3. Specify Scat (scatter diagram) or
xy ( xy line graph) as the graph type, and then execute
the graph operation.
Press A , J or !J (QUIT) to return to the statistical data list.